STI: Spending Patterns™ – Consumer Spending Habits
Discover consumer spending habits and price potential in your trade areas.
STI: Spending Patterns™ – Consumer Spending Habits
Discover consumer spending habits and price potential in your trade areas
How valuable would it be to know how much consumers in your trade areas spend on relevant products and services — and how much they are willing to pay for them?
Knowing consumer spending habits in over 600 products and service categories by geographic area and the prices they have the potential to pay for these items helps companies make informed decisions on everything from site location, to merchandising, to marketing. Getting answers to these questions is as easy as adding STI: Spending Patterns to your research engine.
The source of STI: Spending Patterns data is the Bureau of Labor Statistics (BLS). It is based on the annual Consumer Expenditure Survey, which measures the spending habits of U.S. consumers. Every quarter, Synergos Technologies models this raw data and delivers a weekly per capita, an average spending per capita per week, and a consumer price potential by spending category.
With STI: Spending Patterns, you gain in-depth consumer spending habits, current trends at the block group level, and an ideal companion to other STI data products.
Test STI: Spending Patterns™ in Your Trade Area
STI: Spending Patterns Features & Benefits

Expand Your Consumer Knowledge Base
Gain a vital new layer of quarterly-updated data to enhance your consumer insight and help make more informed decisions

Dig Deeper into Your Trade Areas
Explore how geography influences consumer spending

Review Consumers’ Spending Habits
Learn how much consumers are currently spending in each trade area in over 600 product and service categories
Determine Pricing Strategies by Geography
Identify how much consumers are willing to spend on over 100 products and services

Discover Spending Patterns in Group Quarters
Find out how much people living in dormitory situations are spending on goods and services

Gain Block-Level Insight
Access consumer spending insight at a higher level of precision
Enjoy Responsive Customer Service
Receive STI’s industry-leading customer service — the highest in the data industry
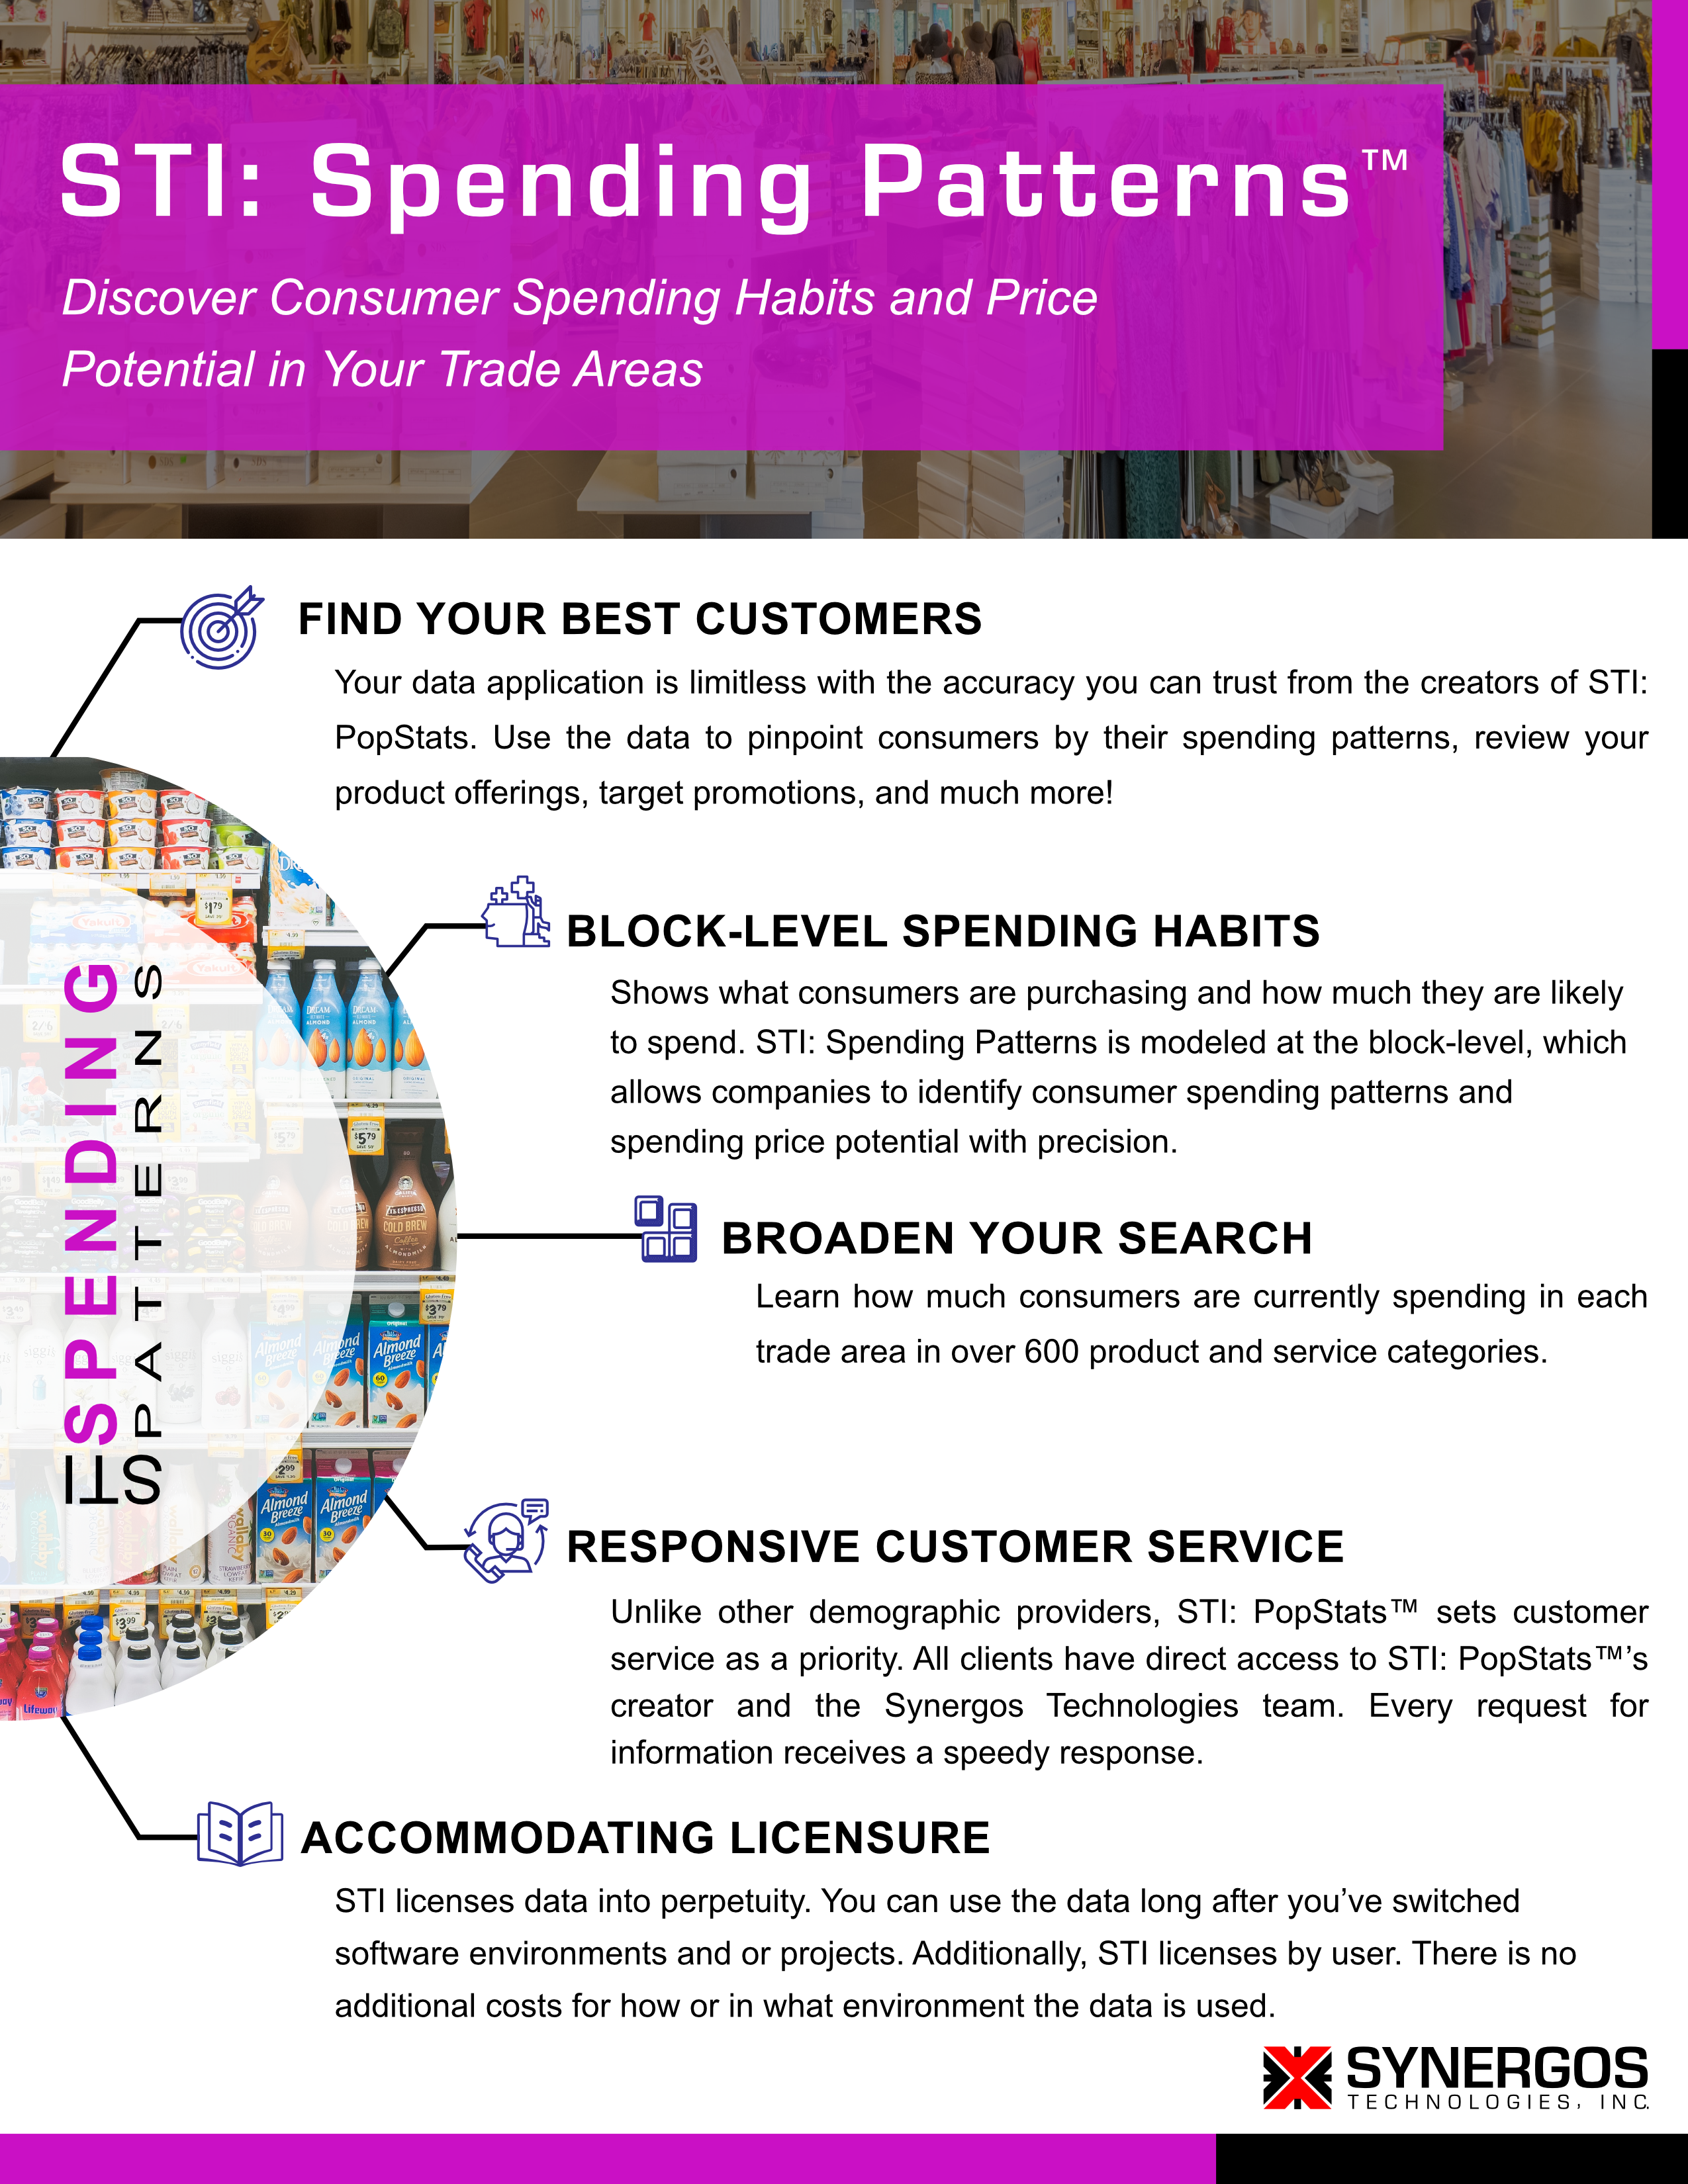
STI: Spending Patterns geographically identifies your most profitable customers and potential customers
Use the data to pinpoint consumers by their spending patterns, segment consumers by spending habits, review your product offerings, and target promotions.
Spending Patterns shows what consumers are purchasing and how much they are likely to spend
STI: Spending Patterns is modeled at the block-level, which allows companies to identify consumer spending patterns and spending price potential with precision.
Provides the companion data to STI: Market Outlook
Market Outlook compares the current supply of goods and services in trade areas to the current consumer demand. While STI: Spending Patterns tells you what consumers are currently purchasing and how much they are willing to pay in the future in specific product and service categories. Together, these two products deliver extremely rich knowledge about consumers within specific trade areas.
Unlike other consumer spending products, STI: Spending Patterns includes specialty data on the spending habits of people living in group quarters. This insight is valuable for retailers with college dormitory residents living in their trade areas.
- STI: Spending Patterns
- Methodology
- Deliverables
Test STI: Spending Patterns in Your Trade Area
Unleash your research potential and enjoy greater confidence in your research — with today’s leading quarterly population and demographic data.
