|
What are the Real Growth Trends in Your Markets and Potential Markets?As every market-focused company knows, all market growth is not created equal. It can be expanding slowly or rapidly, plateauing, cyclical, or both declining and expanding simultaneously. And these different growth trends can all be occurring within a small area. In fact, every market is in an ever-changing- state of fluctuation, because growth is not a discrete function (e.g., growth vs. no growth): It is fluid and constantly adapting to the conditions that influence population growth and decline. This is why knowing a specific market's precise historical growth trend is a powerful way to make the most profitable decisions on future investments, reduce risks, and gain a powerful competitive advantage. Traditionally, retailers could not leverage their investments in population data to track growth trends for three fundamental reasons:
Today, STI: PopStats™ is breaking through all three barriers to analyzing population trends by — for the first time — giving retailers a comprehensive product that updates population data every quarter and delivers eight quarters of revised data on every market in the U.S. With this powerful data in hand, you can answer critical location questions such as:
Now you can see STI: PopStats data's powerful trend analysis capabilities in action in the following five real-world examples.
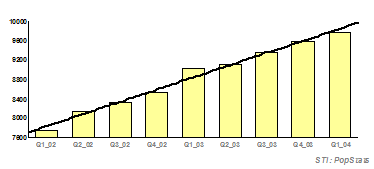
LINEAR GROWTH TREND ANALYSIS - Is it Really a Straight Line?With quarterly population estimates, you can construct a precise picture of the actual historical growth in your markets. The graph below is an excellent example of linear growth, which is de-fined as population growth at a constant rate. This sample, pulled from a census block group in a Phoenix suburb, shows that, indeed, there was quarter-by-quarter population growth at a relatively constant pace over the past two years.
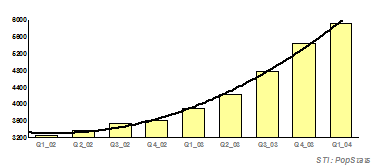
EXPONENTIAL GROWTH TREND ANALYSIS - Is it Accelerating?Exponential growth is a growth rate that is growing at an increasing rate over time. This is typical of most areas that are just entering a growth cycle. It can be the most valuable trend to identify, because it reveals the newest opportunities for retail development. However, it can also be the most risky, because without sufficient historical growth data it can be difficult to assess if the ex-ponential growth represents a major or minor development trend.
This graph shows a strong, steady upward cycle of exponential growth quarter-by-quarter in a Phoenix suburb (a different area than the linear growth example). This type of insight convinced a national retailer to accelerate its investment in this market.
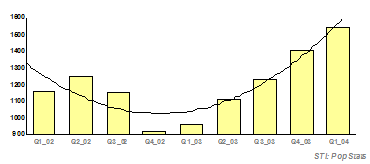
PLATEAUING GROWTH TREND ANALYSIS - Has it Peaked?Markets that are experiencing plateauing growth are near the end of a growth cycle and are defined as a growth rate that is growing at a declining rate. The formation of a plateau is the first sign that an area is reaching maturity or that investment and housing dollars are beginning to shrink. This stage is the most reliable in determining the growth potential. However, unfortunately by the time an area has reached this stage the opportunity for retail development has almost vanished, because competitors have already locked in the most desirable real estate loca-tions and the consumers' market share potential.
CYCLICAL GROWTH TREND ANALYSIS - Are the Cycles Changing?Cyclical growth is characterized as a growth pattern that repeats itself at regular intervals. The most common growth cycle reflects seasonality. Cyclical growth often bears the most influence on the type of store format a retailer builds in an area or the operation of the business.
Note: The vastly different growth trends of four contiguous suburban areas southeast of Phoenix, Arizona, shown in these four examples, further demonstrates the highly fluid nature of population growth and decline within today's constantly changing markets.
RAZE AND RE-BUILD GROWTH TREND ANALYSIS - Is an Area Declining and Expanding?The raze and re-build growth trend is not, per se, a cycle, but rather a combination of two distinct growth cycles of decline and expansion. However, it illustrates a type of growth that can have a dramatic impact on store development. For example, it can help retailers answer critical questions such as:
Now You Can Gain Powerful Market Growth Trend Analysis Capabilities with STI: PopStats DataUntil the introduction of STI: PopStats, capturing growth trends on the neighborhood level was virtually impossible. Today STI: PopStats data delivers all of the essential capabilities that retailers require to assess actual historical growth in any market in the U.S. What's more, unlike any other population statistics provider, STI: PopStats data encourages market developers to perform trend analysis - and we support their efforts by delivering highly accurate estimates on-time, four times a year. This strategic quarter-by-quarter growth trend insight is an enormous advantage in today's increasingly competitive markets, where having accurate market insight improves your ability to make profitable market decisions, reduces your market investment risks, and gives you a powerful competitive advantage. Why not see the exact growth trends that are occurring in your critical markets with today's most powerful growth trend tracking tool - STI: PopStats? |
 While linear growth is the traditional way that retailers view market growth,
not all market growth is linear. For example, if two estimates report that the
population in a particular market is 5,000 today and was 1,000 three years ago,
most demographers would report a 71% per annum growth rate over three years.
While mathematically this is true, in reality the population may not have
increased at a constant rate. In fact, the entire increase in population could
have occurred in a single year. The bottom line: don't let two points on a
graph convince you that the growth is a straight line.
While linear growth is the traditional way that retailers view market growth,
not all market growth is linear. For example, if two estimates report that the
population in a particular market is 5,000 today and was 1,000 three years ago,
most demographers would report a 71% per annum growth rate over three years.
While mathematically this is true, in reality the population may not have
increased at a constant rate. In fact, the entire increase in population could
have occurred in a single year. The bottom line: don't let two points on a
graph convince you that the growth is a straight line.
 Typically only the most aggressive risk-takers are willing to invest in retail
development in these areas without additional market research to confirm the
strength of the growth. However, all marketers can benefit from knowing that
some form of initial growth is occurring and, as a result, bears further
investigation or ongoing monitoring.
Typically only the most aggressive risk-takers are willing to invest in retail
development in these areas without additional market research to confirm the
strength of the growth. However, all marketers can benefit from knowing that
some form of initial growth is occurring and, as a result, bears further
investigation or ongoing monitoring.
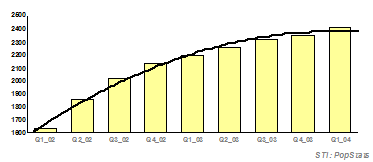 The quarterly population estimates illustrated in this graph revealed a
significant peak in the cycle of exponential growth in a Phoenix suburb (a
different area than the linear and exponential growth depicted above). Seeing
the actual growth trends in this area convinced a national retailer to invest in
operations rather than expanding its store network in the area.
The quarterly population estimates illustrated in this graph revealed a
significant peak in the cycle of exponential growth in a Phoenix suburb (a
different area than the linear and exponential growth depicted above). Seeing
the actual growth trends in this area convinced a national retailer to invest in
operations rather than expanding its store network in the area.
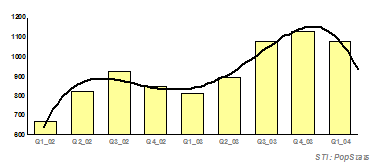 STI: PopStats quarterly estimates do a superior job of capturing cycles, as
illustrated in this chart. This example shows the growth cycles in a market
area just outside of Phoenix that is dominated by winter vacationers (a
different area than the linear, exponential, and plateauing growth examples
above). In this example, two growth curves are occurring simultaneously: a
seasonal cycle and an underlying growth trend. Eventually the seasonal cycle
may be displaced by the area's overall volume of growth.
STI: PopStats quarterly estimates do a superior job of capturing cycles, as
illustrated in this chart. This example shows the growth cycles in a market
area just outside of Phoenix that is dominated by winter vacationers (a
different area than the linear, exponential, and plateauing growth examples
above). In this example, two growth curves are occurring simultaneously: a
seasonal cycle and an underlying growth trend. Eventually the seasonal cycle
may be displaced by the area's overall volume of growth.
 Whatever your business decision, you'll make it with much greater confidence,
since you were able to see clearly the exact population trends - just like the
national retailer who conducted the trend analysis seen on the chart to the
right for an area south of Tampa. With this insight, the company was able to
make the profitable decision to open a second store in the area.
Whatever your business decision, you'll make it with much greater confidence,
since you were able to see clearly the exact population trends - just like the
national retailer who conducted the trend analysis seen on the chart to the
right for an area south of Tampa. With this insight, the company was able to
make the profitable decision to open a second store in the area.