|
Tell Me More
|
| |
|
Vortex VDB Reports Does the Work for You
|
|
Imagine clicking a button and you instantly have professional-looking reports
available for critical location or customer analysis. That's the unique report-generation
power of Vortex VDB Reports. With this dynamic tool, all the data you've always
wanted -- and more -- is now available at your fingertips in highly-useful
formats that incorporate color, graphics, and photos.
No more long hours spent analyzing spreadsheets and statistical relationships,
then formatting the information into intelligent reports. Within minutes Vortex
VDB's powerful interface pulls the exact data you need from the comprehensive
and versatile MapInfo® desktop mapping program, calculates it, and formats it
into a nearly unlimited array of reports. In fact, the only limit is your imagination.
Vortex VDB Reports combines the strength of advanced geographic information
systems (GIS) with the flexibility and functionality of spreadsheets and desktop
publishing tools. As a result, the power and speed of on-demand location and
customer analysis reports saves you the expense and time of generating them
manually, and virtually eliminates errors. It also allows businesses to easily
maintain corporate standards from one document to the next. This instant access
to better and more specific information means you'll have faster, more comprehensive
decision-making potential than ever before.
|
|
A New Wealth of Data in Unlimited Report Options
|
|
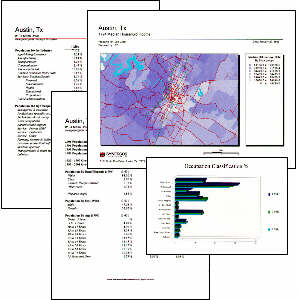
Not only does Vortex VDB Reports come with a vast selection of standardized reports,
but it allows you to easily create customized reports that fit your exact business
information requirements. Here are just some of the unique and dynamic reports you'll
have available automatically to visually analyze select market areas:
- Comparative Analysis. Compare existing trade areas with new target markets.
- Trade Area Analysis. Define your specific trade area or areas, no matter what
their shape, and instantly collect all the data relevant to your research in that area.
- Score Card Analysis. Data is conveniently organized into rows and columns, and then
color-coded for easy review and at-a-glance analysis of the selected variables.
- Competitive Analysis. Provides instant, detailed analysis of any competitor.
Along with a vast selection of dynamic reports, Vortex VDB Reports also allows you to
enhance your data's visual presentation by creating a wide array of colorful and
useful charts -- instantly. You have automatic access to the standard pie, bar,
and line charts, as well as specialized business charts such as area, scatter, and ribbon.
|
|
STI Innovation at Work
|
|
Vortex VDB Reports was created from a simple question: wouldn't it be infinitely
easier to push a few buttons to create a set of professionally-designed reports
than to manually calculate numbers and create each report from scratch? With that
thought in mind, STI's team of interface designers and developers set to work.
They pulled together all of the necessary GIS data and interface software, and
added the flexibility and functionality of spreadsheet and desktop publishing
software. Today, businesses can have this on-demand access to any market
analysis they need to make their store networks stronger and more successful!

|

 STI: Vortex VDB Reports directly addresses one of the most frustrating problems
of today's market-driven business executives -- how to have on-demand access
to market and customer data in highly-useful formats. Vortex VDB Reports gives
you a vast selection of reports and charts so fast, information-packed, and
professionally - designed, you'll never imagine accessing analytical data any
other way again.
STI: Vortex VDB Reports directly addresses one of the most frustrating problems
of today's market-driven business executives -- how to have on-demand access
to market and customer data in highly-useful formats. Vortex VDB Reports gives
you a vast selection of reports and charts so fast, information-packed, and
professionally - designed, you'll never imagine accessing analytical data any
other way again.
