Tourism
Seasonal Population
Population that resides in the area less than 6 months a year.
Seasonally Population - Not Very Dependent
The Sacramento-Yuba City-Yolo, CA Market has an annual Seasonal Population of 153,927 to a Population of 2,845,775. This results in a Seasonal Dependency Ratio of 0.054, which ranks 87th across STI Markets.
Seasonal Population - Medium level of Variation
Seasonal visitation peaks in the Summer with a Seasonal Population of 64,236. The off season is the Spring with a Seasonal Population of 27,098. Given the difference between the primary and off seasons the Sacramento-Yuba City-Yolo, CA Market is classified as having a Medium level of seasonal variation, ranking 153rd across STI Markets.
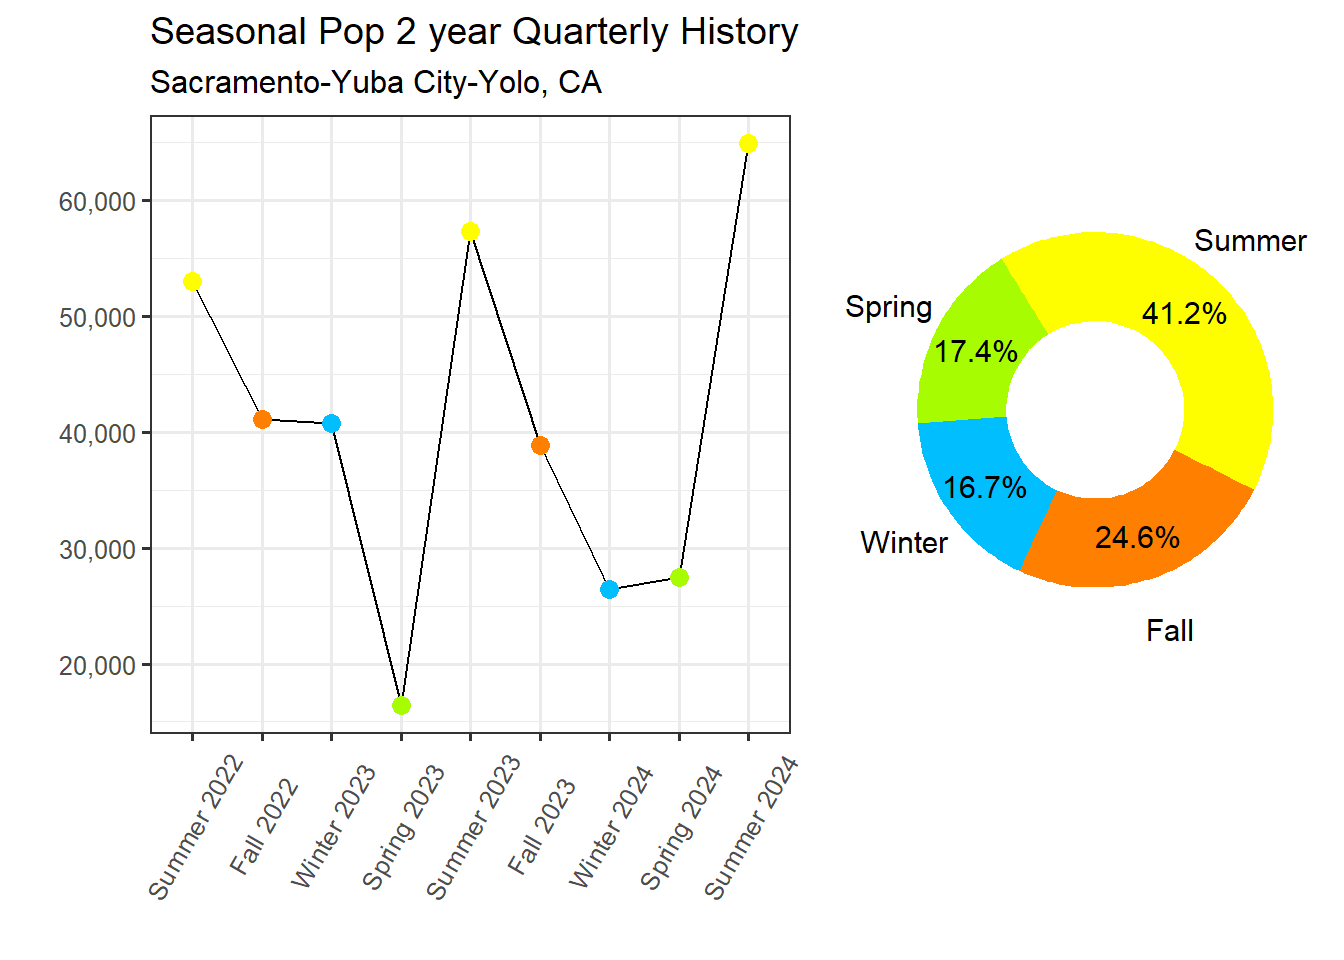
Figure 7: Transient Population Proportion
Transient Population
Calculation of the average number of overnight stays at Hotels, RV parks, and Campgrounds in the given season. This measure is more subject to impacts from time specific market changes. Following data based on last year.
Transient Population - Not Very Dependent
The Sacramento-Yuba City-Yolo, CA Market has an annual Transient Population of 107,077 to a Population of 2,845,775. This results in a Transient Dependency Ratio of 0.038, which ranks 129th across STI Markets.
Transient Population - High level of Seasonal Variation
Transient visitation peaks in the Summer with a Transient Population of 39,507. The off season for transient visitation is the Winter with an avg over night stay count of 20,227. Given the difference between the primary and off seasons the Sacramento-Yuba City-Yolo, CA Market is classified as having a High level of transient seasonal variation, ranking 69th across STI Markets.
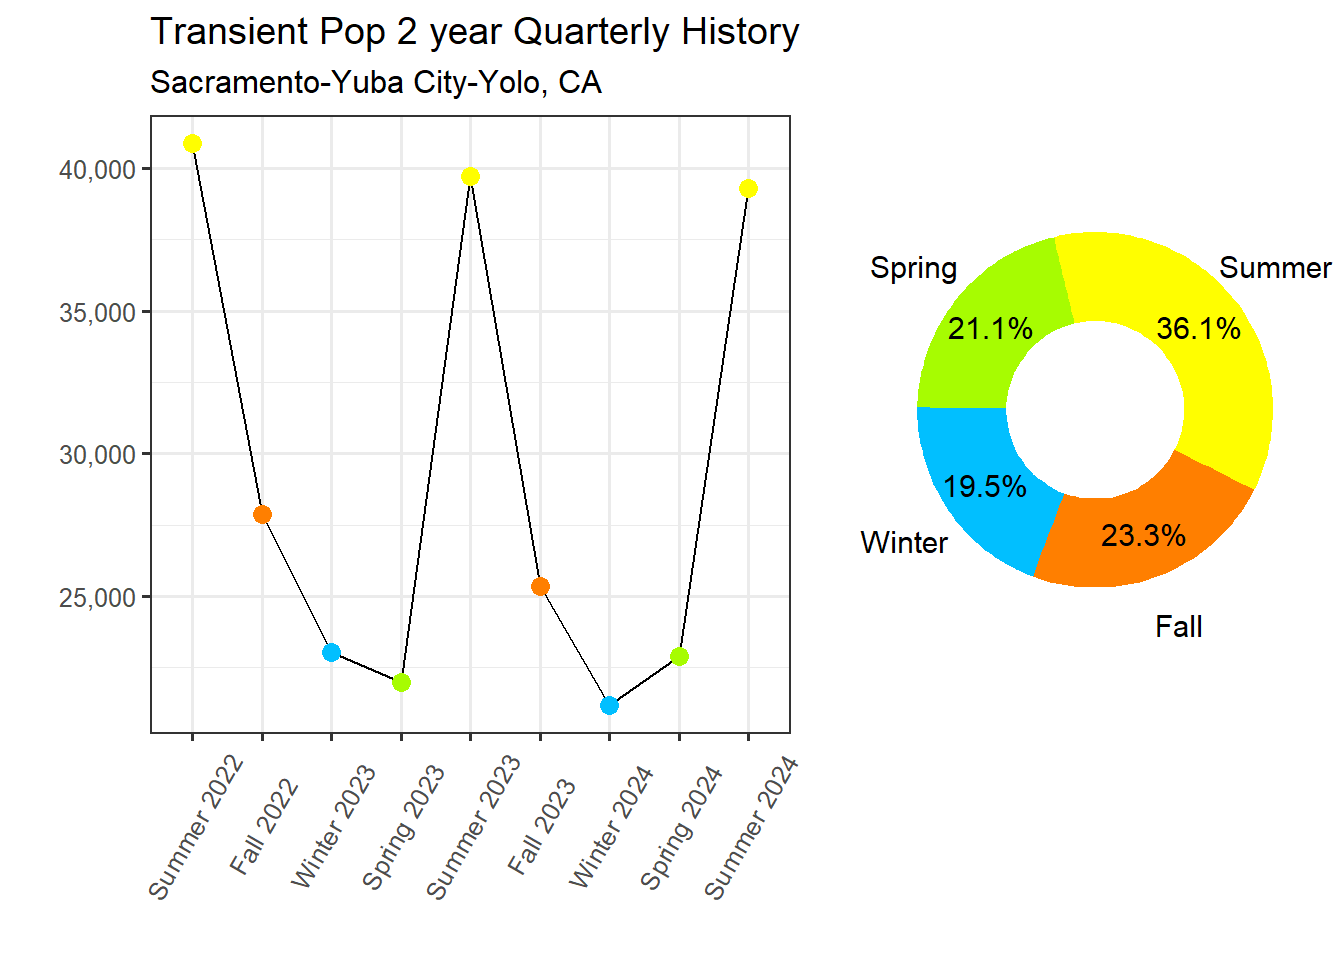
Figure 8: Transient Population Proportion
Sub-Market Concentrations
County Transient and Seasonal Patterns
Depending on the market the Seasonal Population and Transient Population seasonal trends may align or contrast. Additionally, a counties may have none, one, or both of these populations. The chart below shows trend lines of both these Populations across the last 2 years. They have been normalized and in order to keep the focus on the counties with greater dependence the transparency of the trend line and the text label size have been scaled by that dependence. For markets with many counties, only 15 lines will be shown, lines are ordered by population.
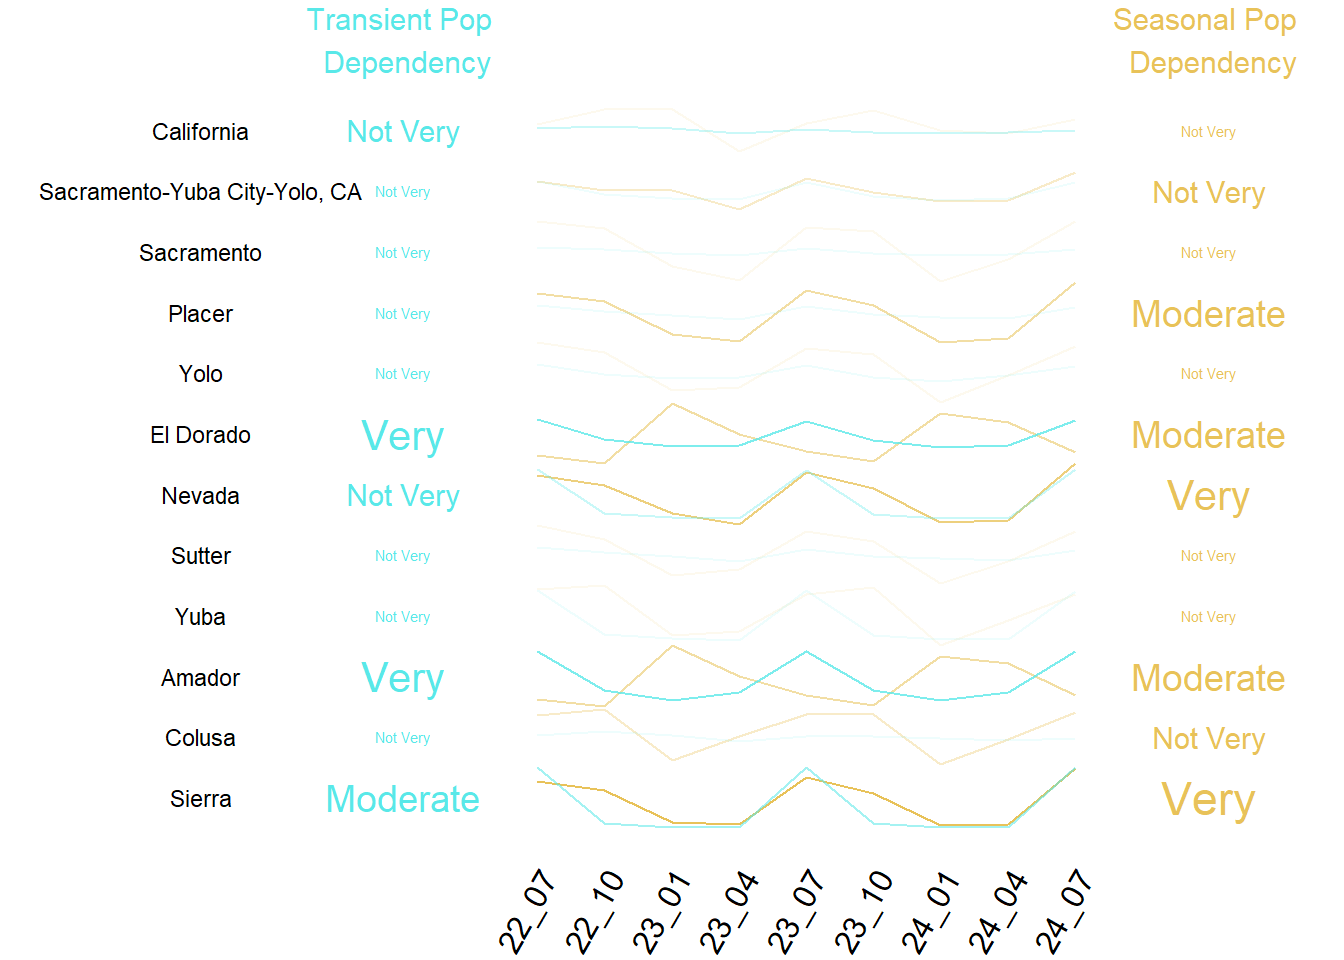
Figure 9: Summary of Transient and Seasonal Pop by County
Bivariate Comparison of Transient and Seasonal Pop
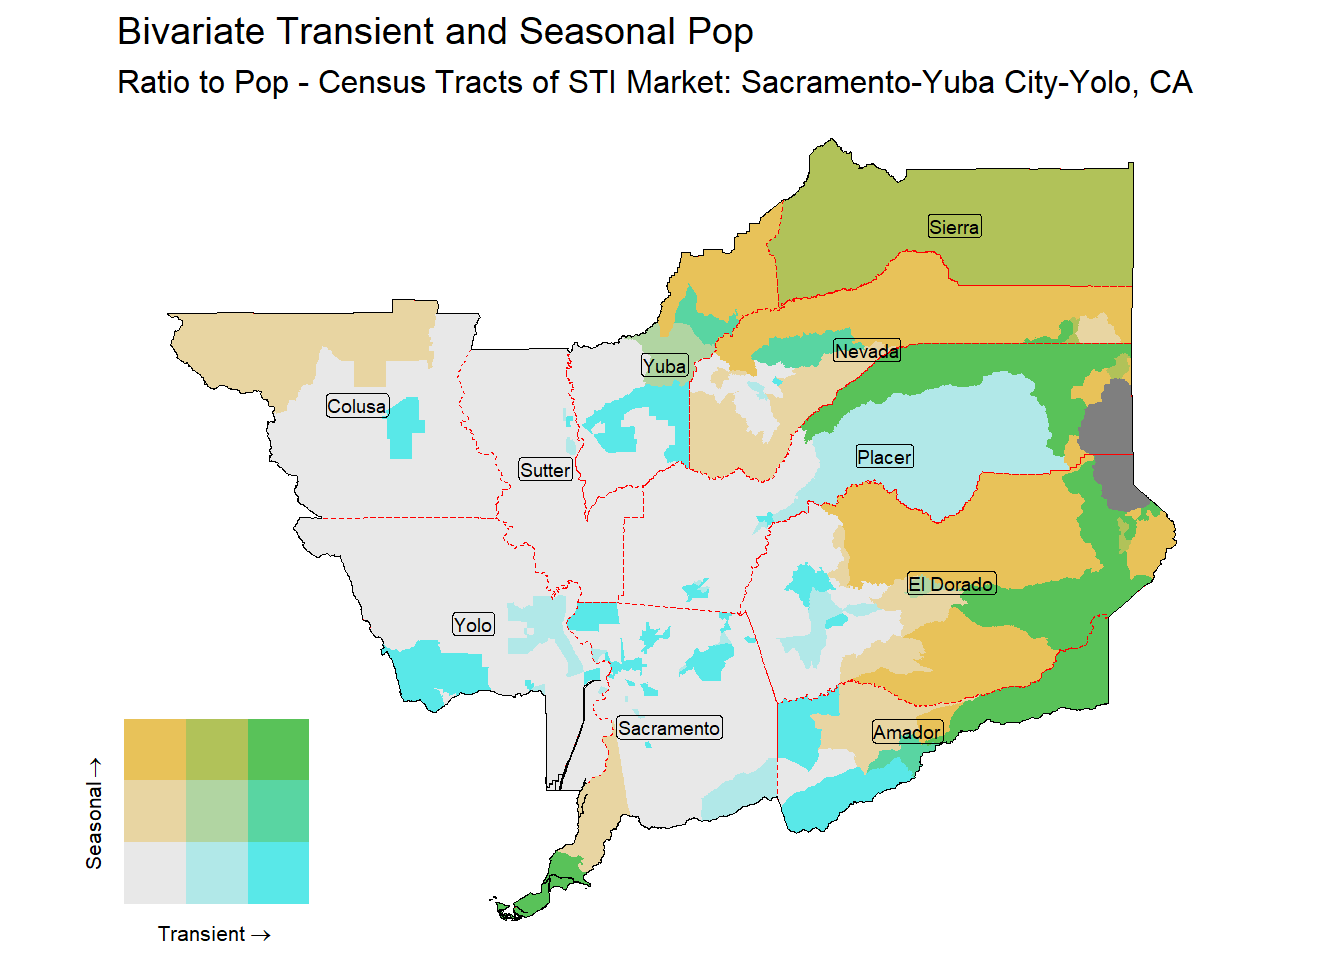
Figure 10: Bivariate Tematic of Seasonal & Transient Pop - Census Tract
The ratios of Seasonal Population to Population and Transient Population to Population are used to create the above map. The 3 levels for Transient are created with breaks at the ratio values of 0.06 and 0.1. The 3 levels for Seasonal are created with breaks at the ratio values of 0.07 and 0.3.