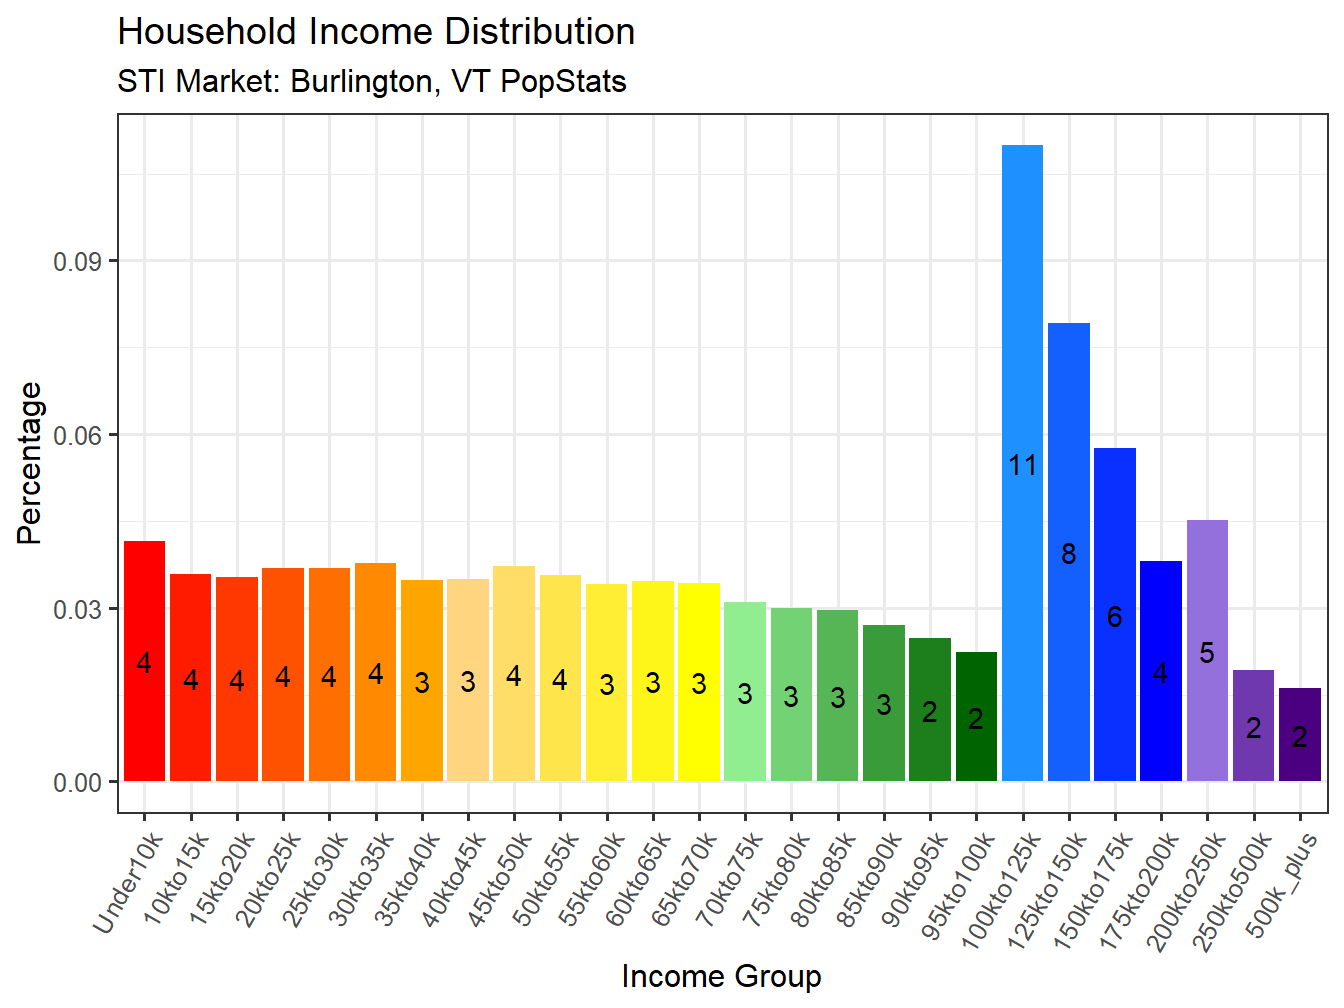
Income
Household Income (HHI)
Median HHI - $83,999
With a Median Household Income of $83,999 the Burlington, VT Market ranks 56th across STI Markets.
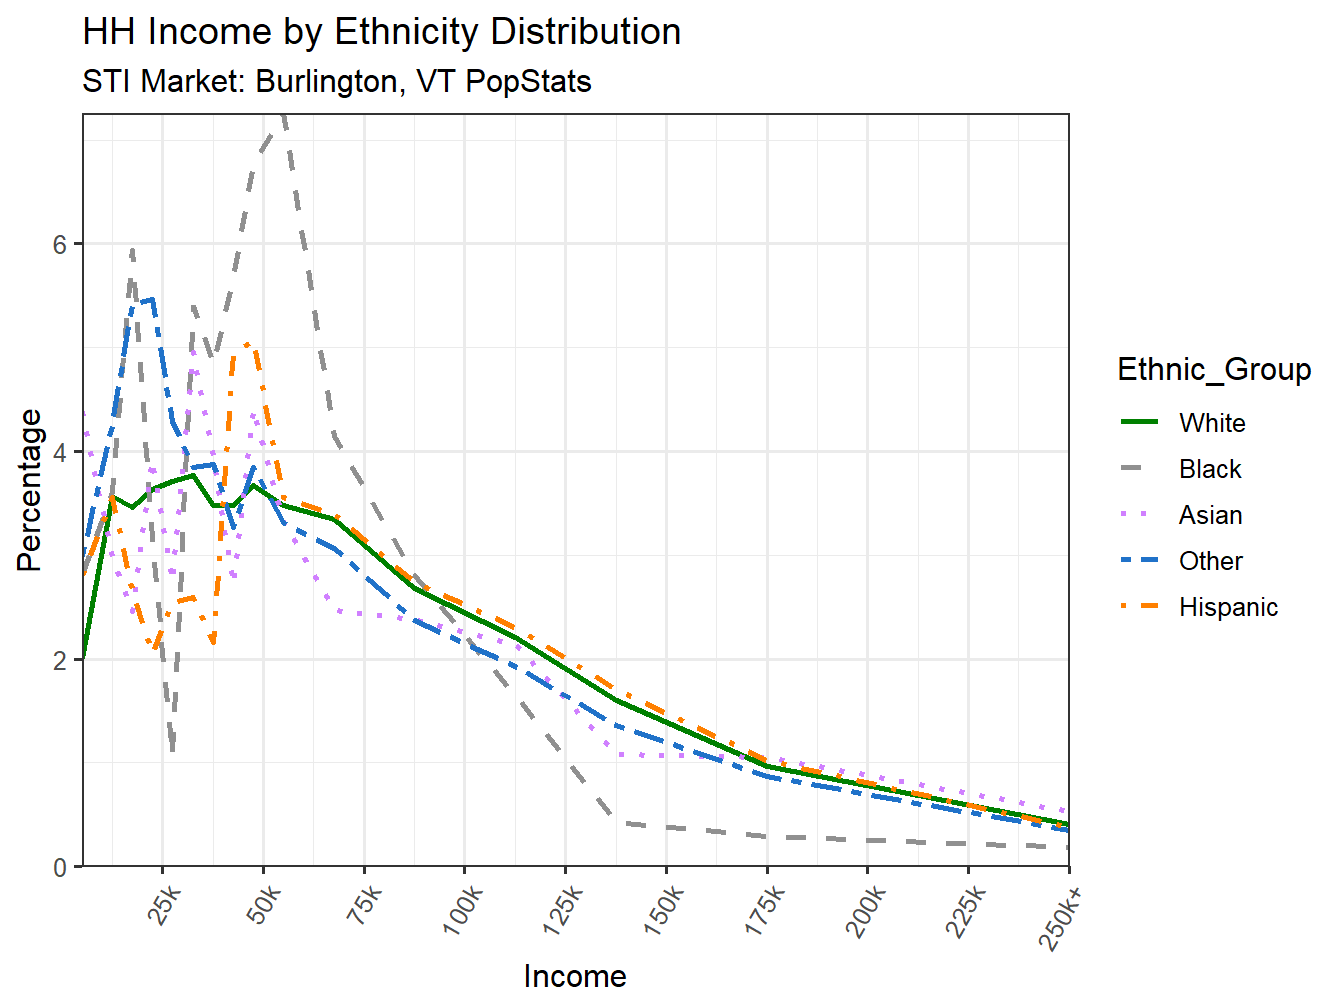
Income Distribtuion Line
Below the multi-colored line represents the same data for household income in the Burlington, VT market, but more equally lays out the distribution of population versus the income level, correcting for differences in size of income ranges. You will also notice that after 200k the income ranges are scaled down so the focus is more centered on the more numerous Households making under 200k. The black line represents the National Income Distribution for comparison.
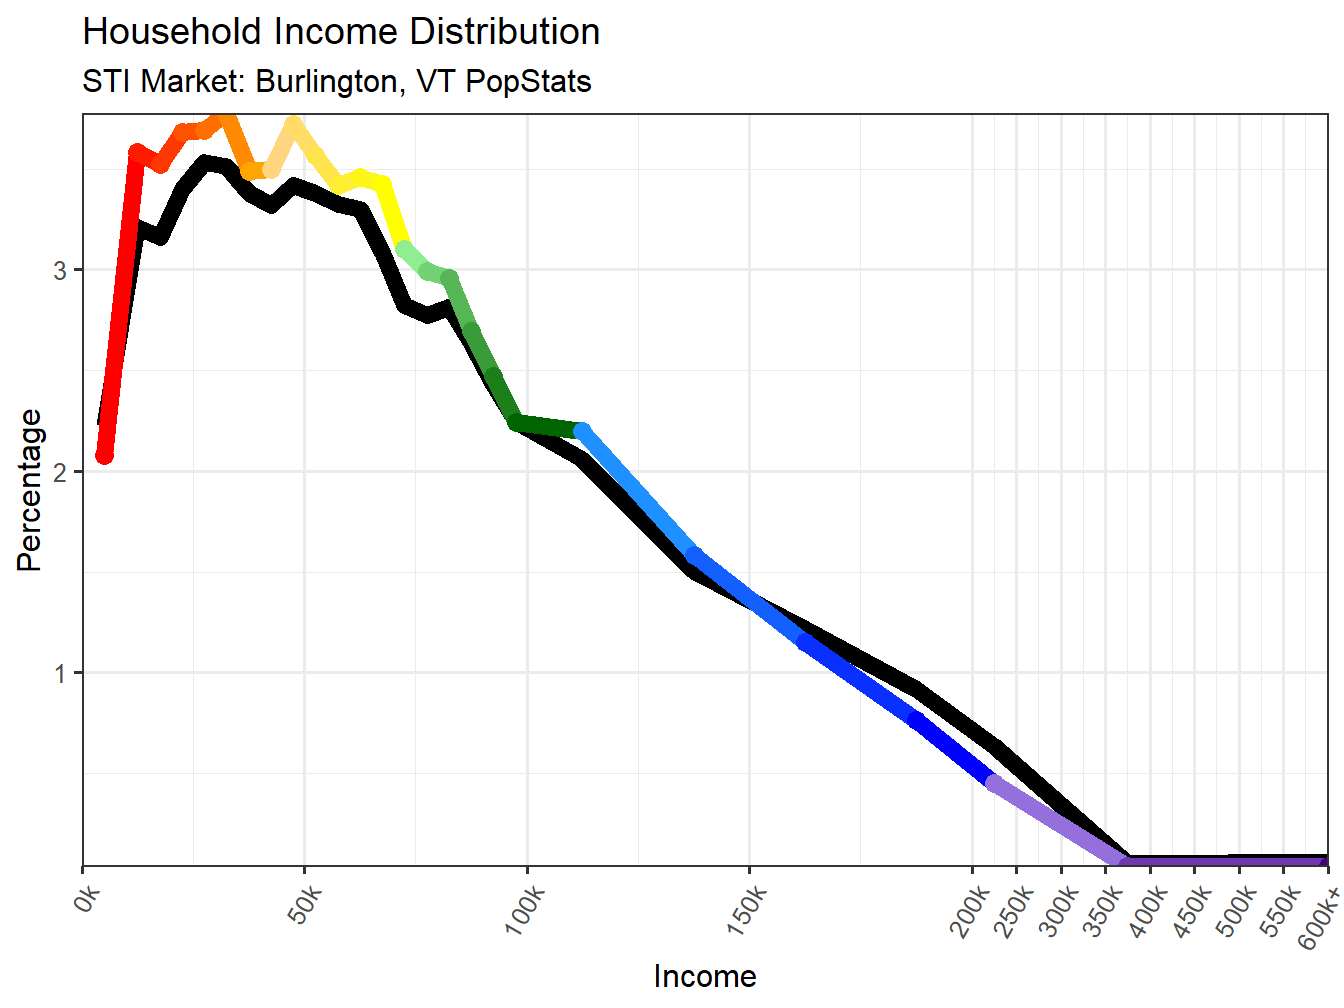
Figure 38: Income Distribution Line
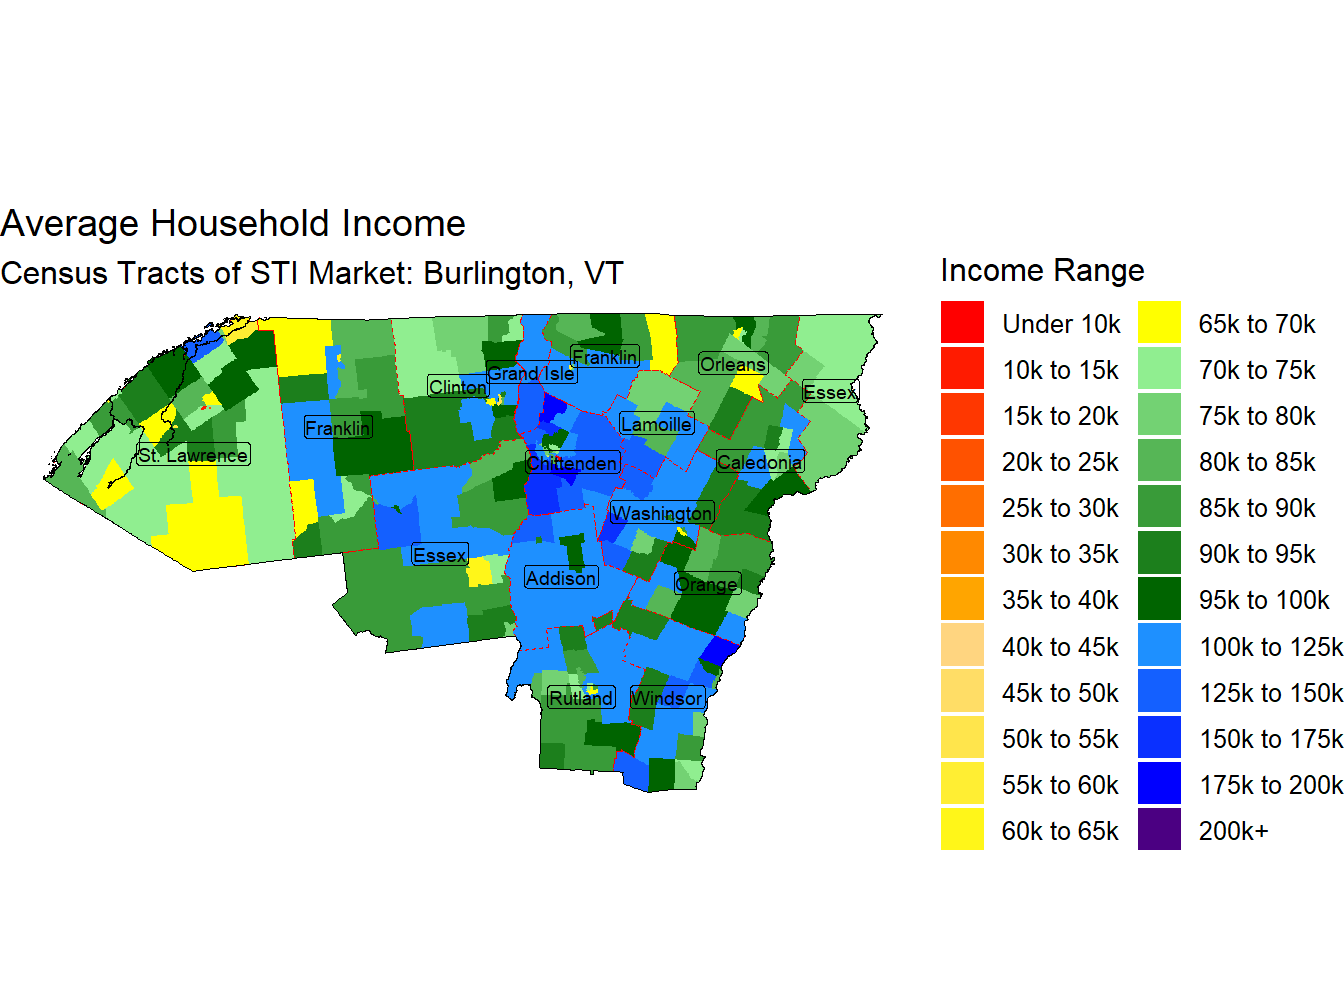
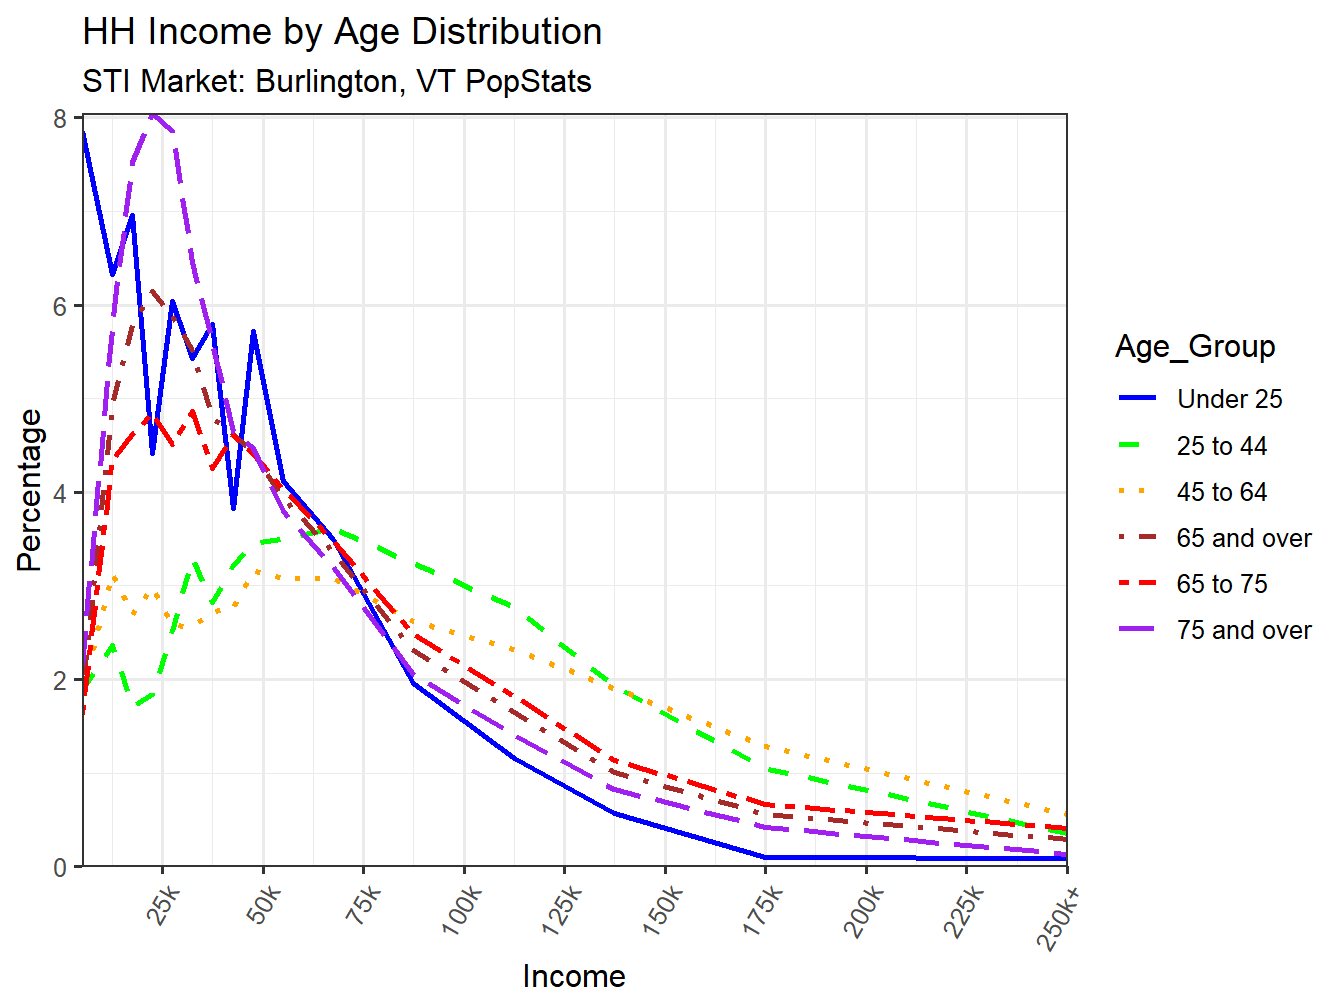
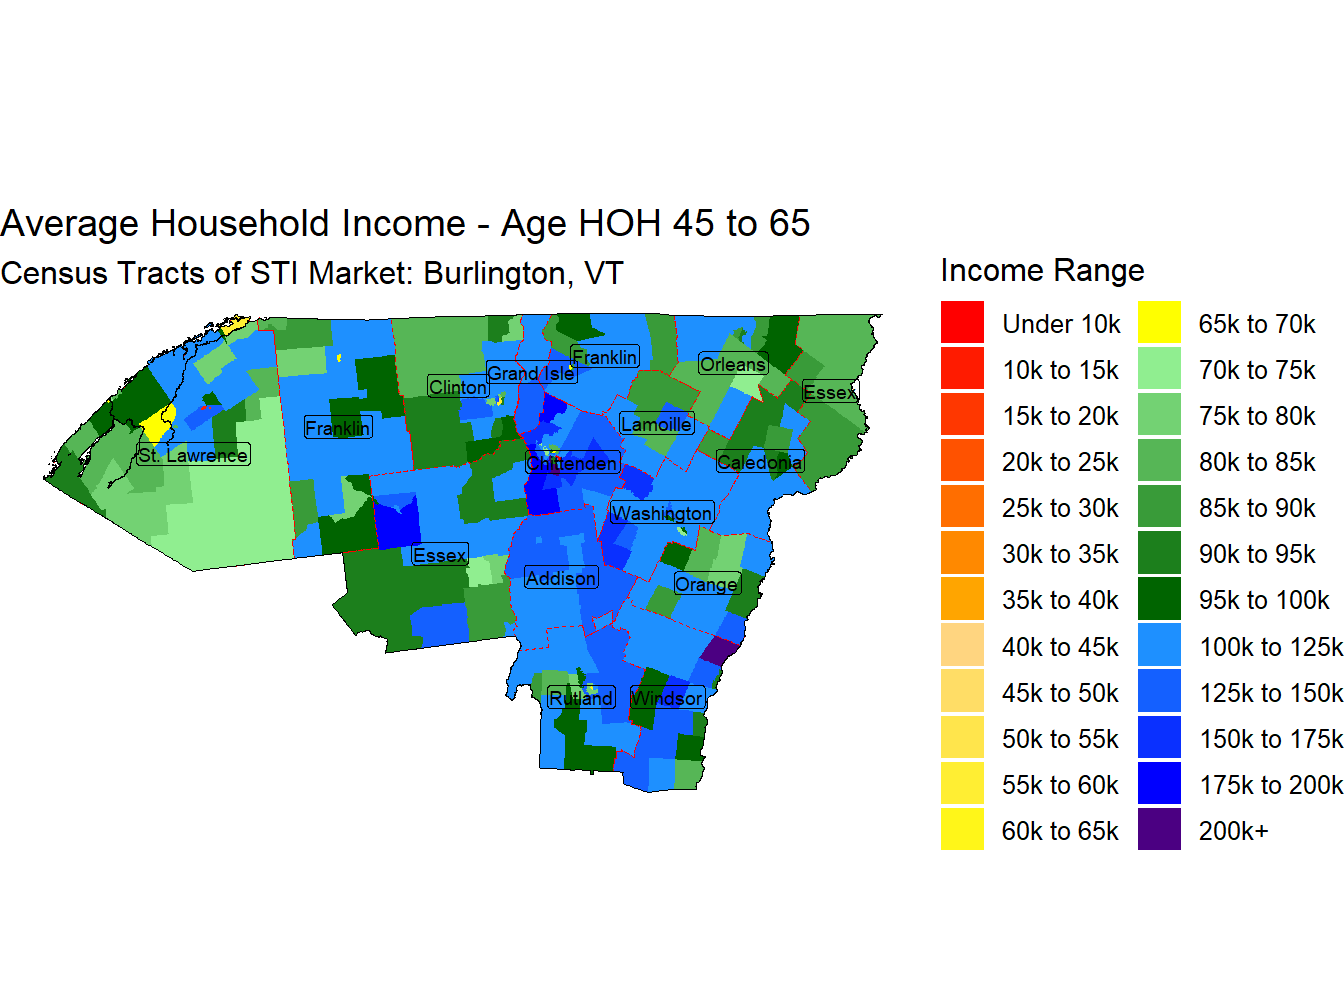
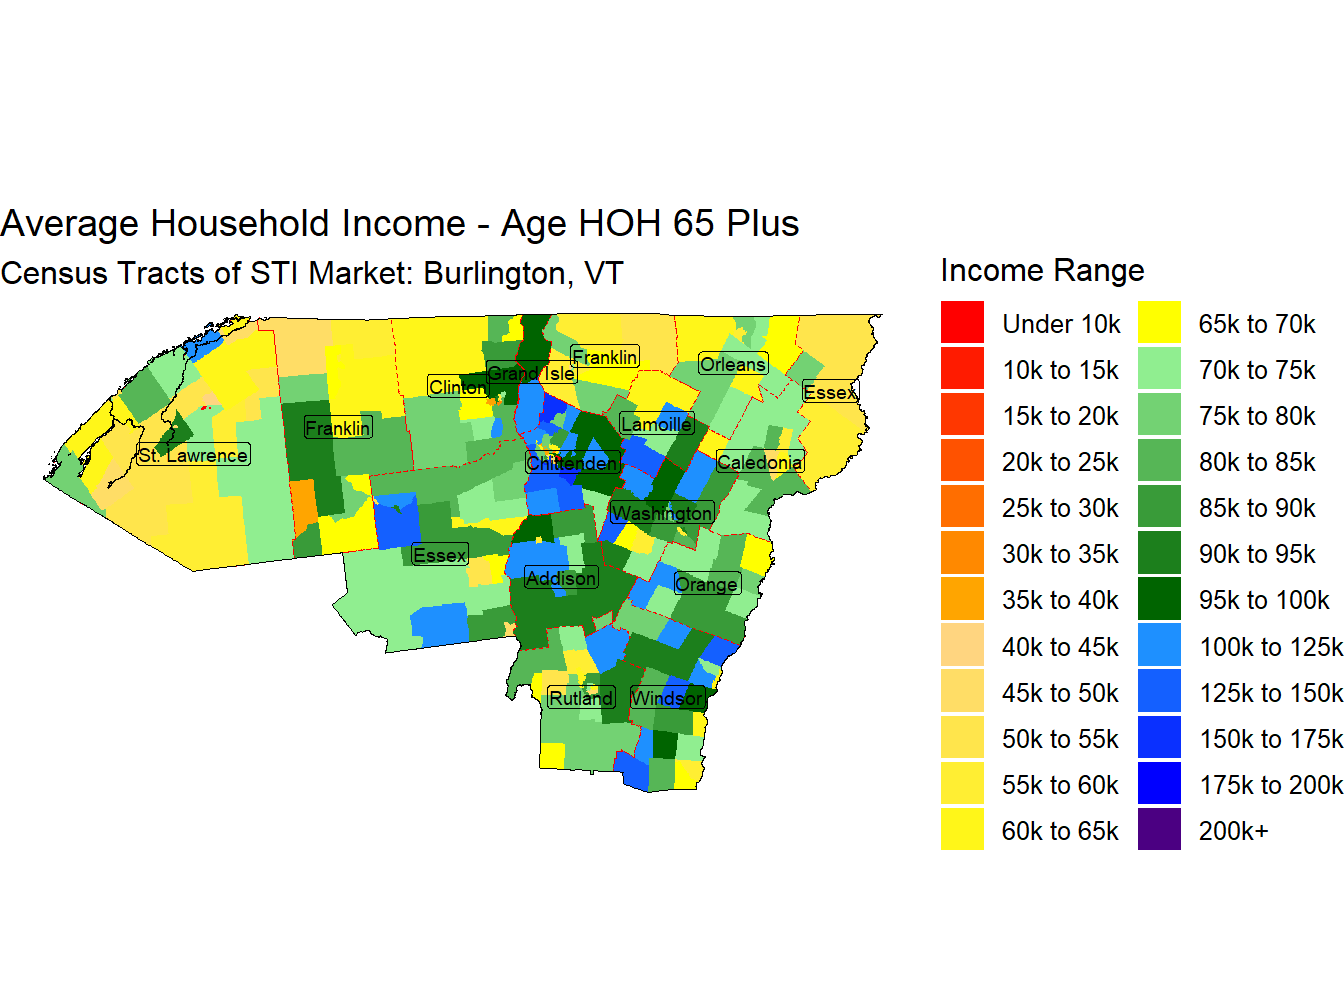
HH Income by Age of Head of Householder
HHI Age under 25 - $64,698
With an Average Household Income for those head of householders aged under 25 of $64,698 the Burlington, VT market ranks 80th across STI Markets.
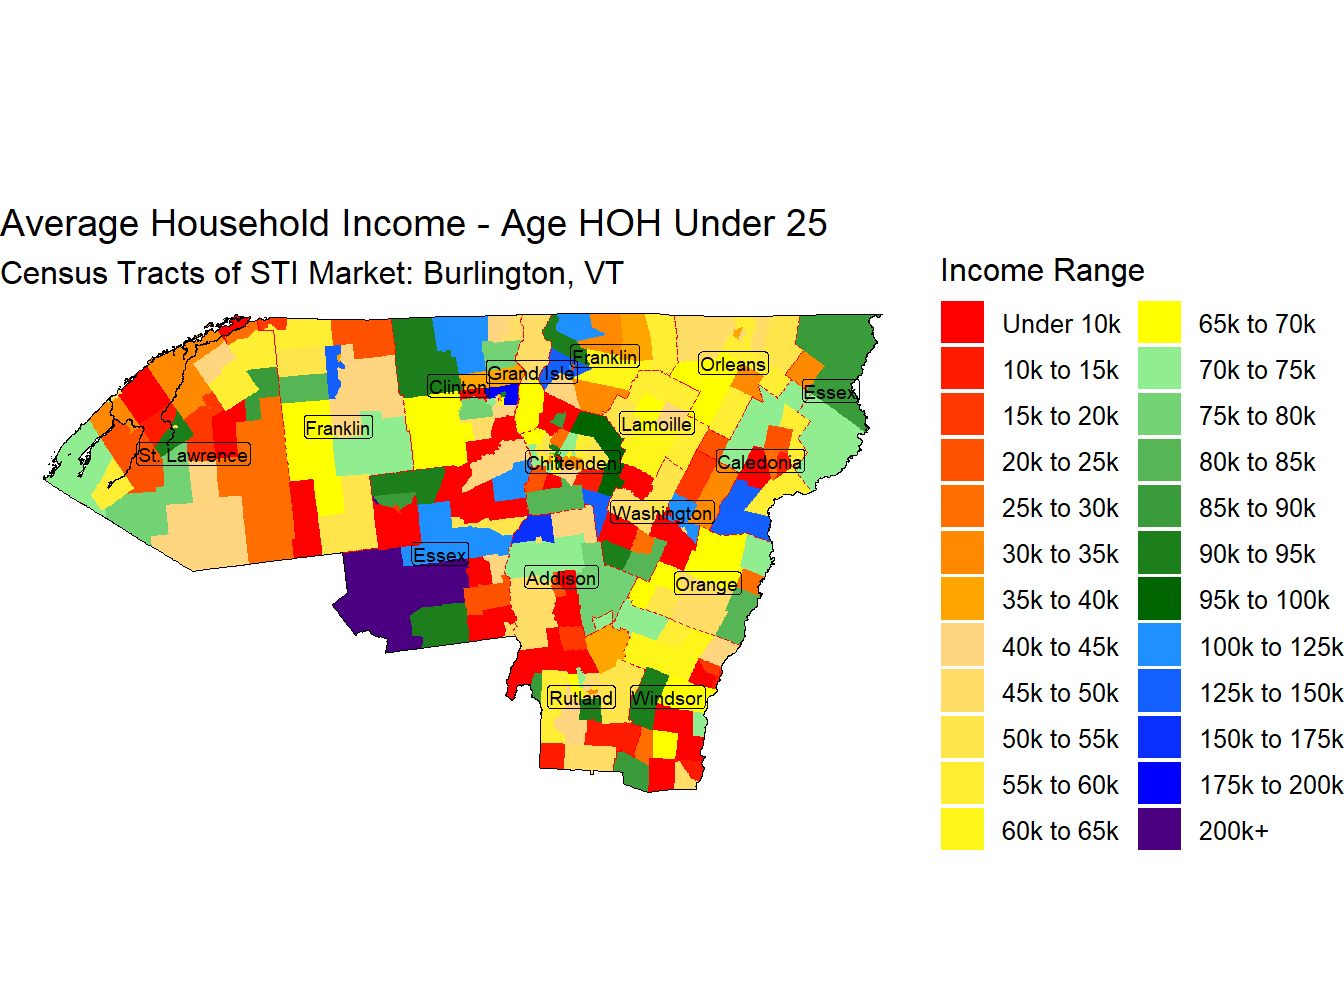
Figure 41: HHI 00to25 Thematic
HHI Age 25 to 45 - $119,877
With an Average Household Income for those head of householders aged 25 to 45 of $119,877 the Burlington, VT market ranks 54th across STI Markets.
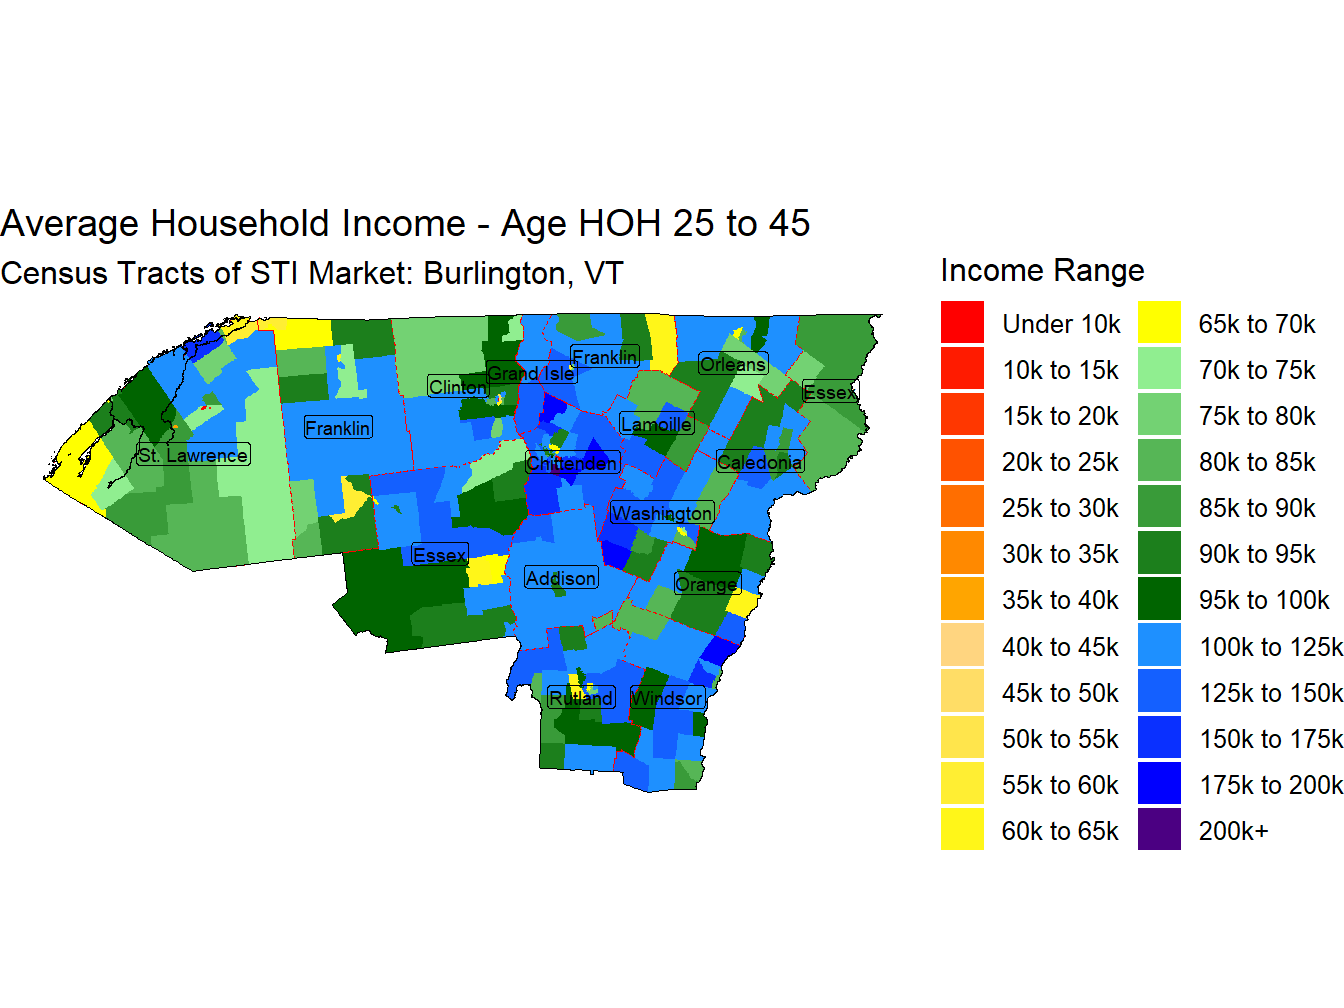
Figure 42: HHI 25to45 Thematic
HH Income by Age of Head of Householder
HHI White - $110,378
With an Average Household Income for those head of householders Non-Hispanic White of $110,378 the Burlington, VT market ranks 73rd across STI Markets.
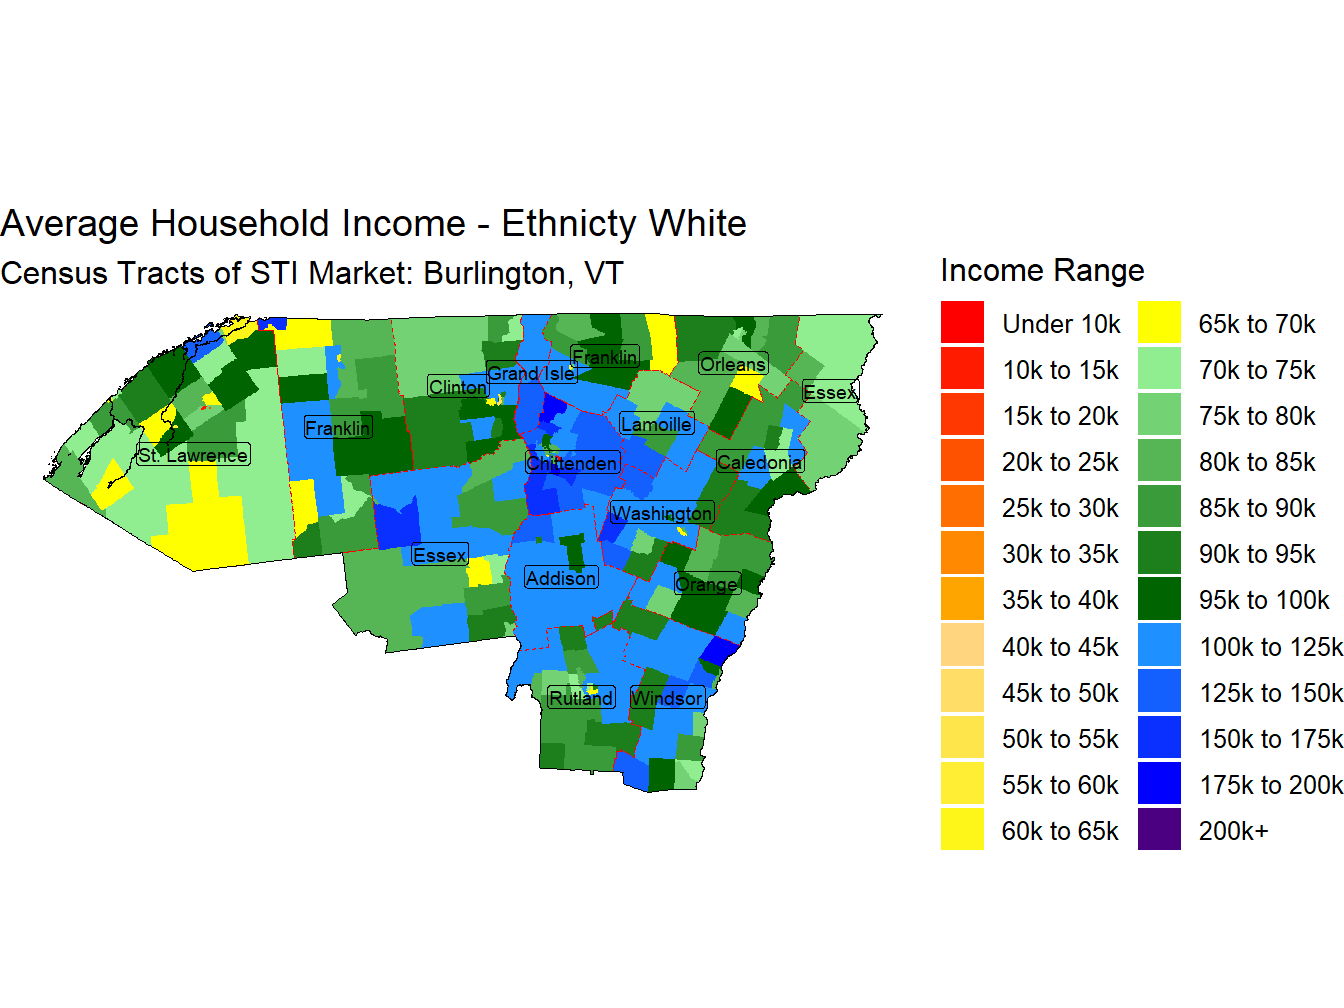
Figure 46: HHI white Thematic
HHI Black - $87,946
With an Average Household Income for those head of householders identifying as Non-Hispanic Black of $87,946 the Burlington, VT market ranks 56th across STI Markets.
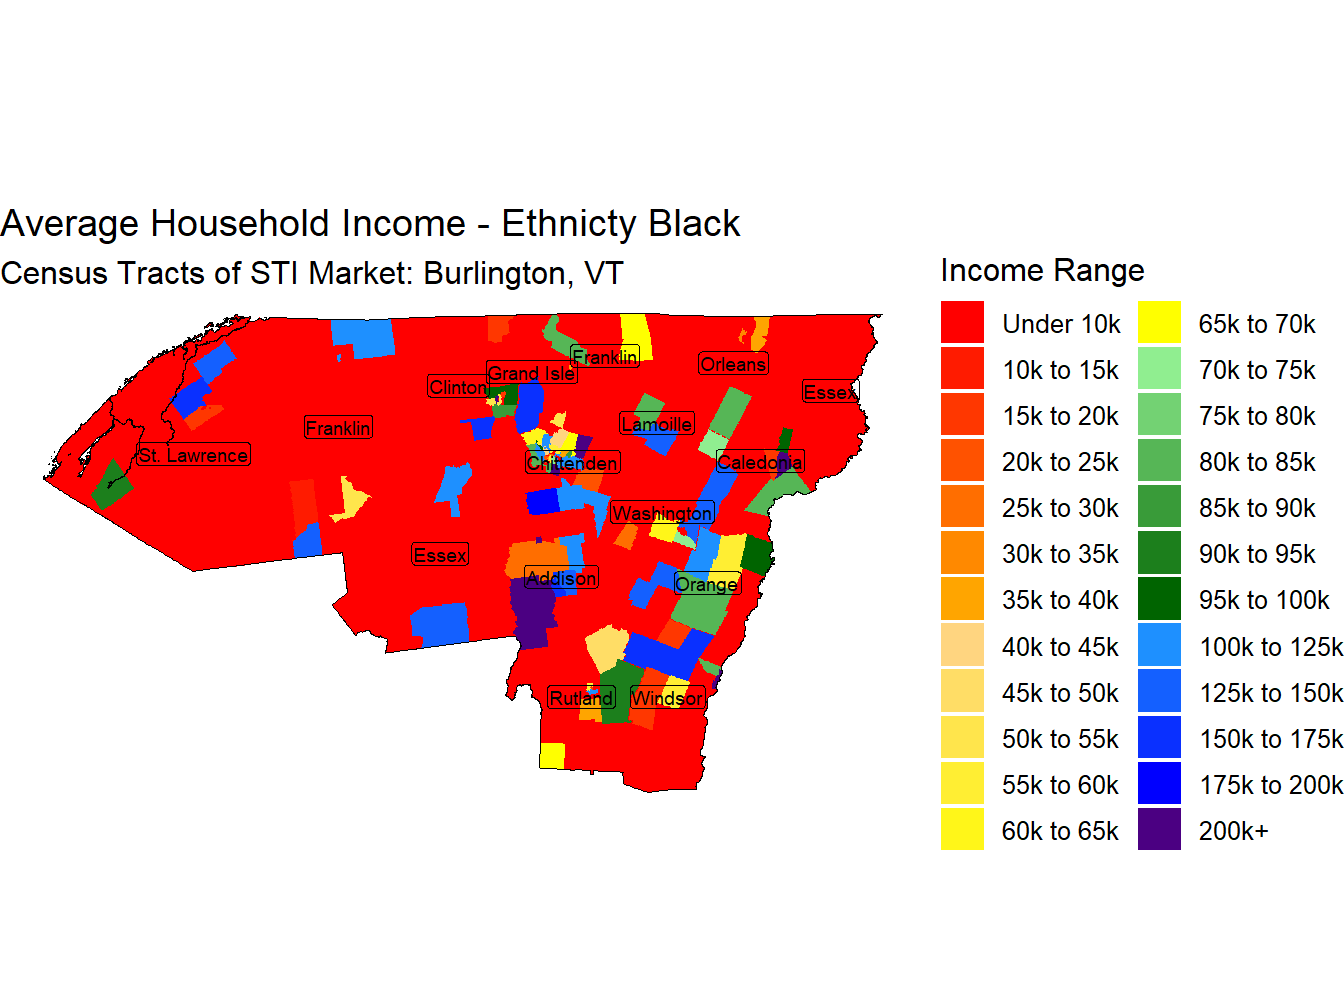
Figure 47: HHI black Thematic
HHI Asian - $112,579
With an Average Household Income for those head of householders identifying as Non-Hispanic Asian of $112,579 the Burlington, VT market ranks 104th across STI Markets.
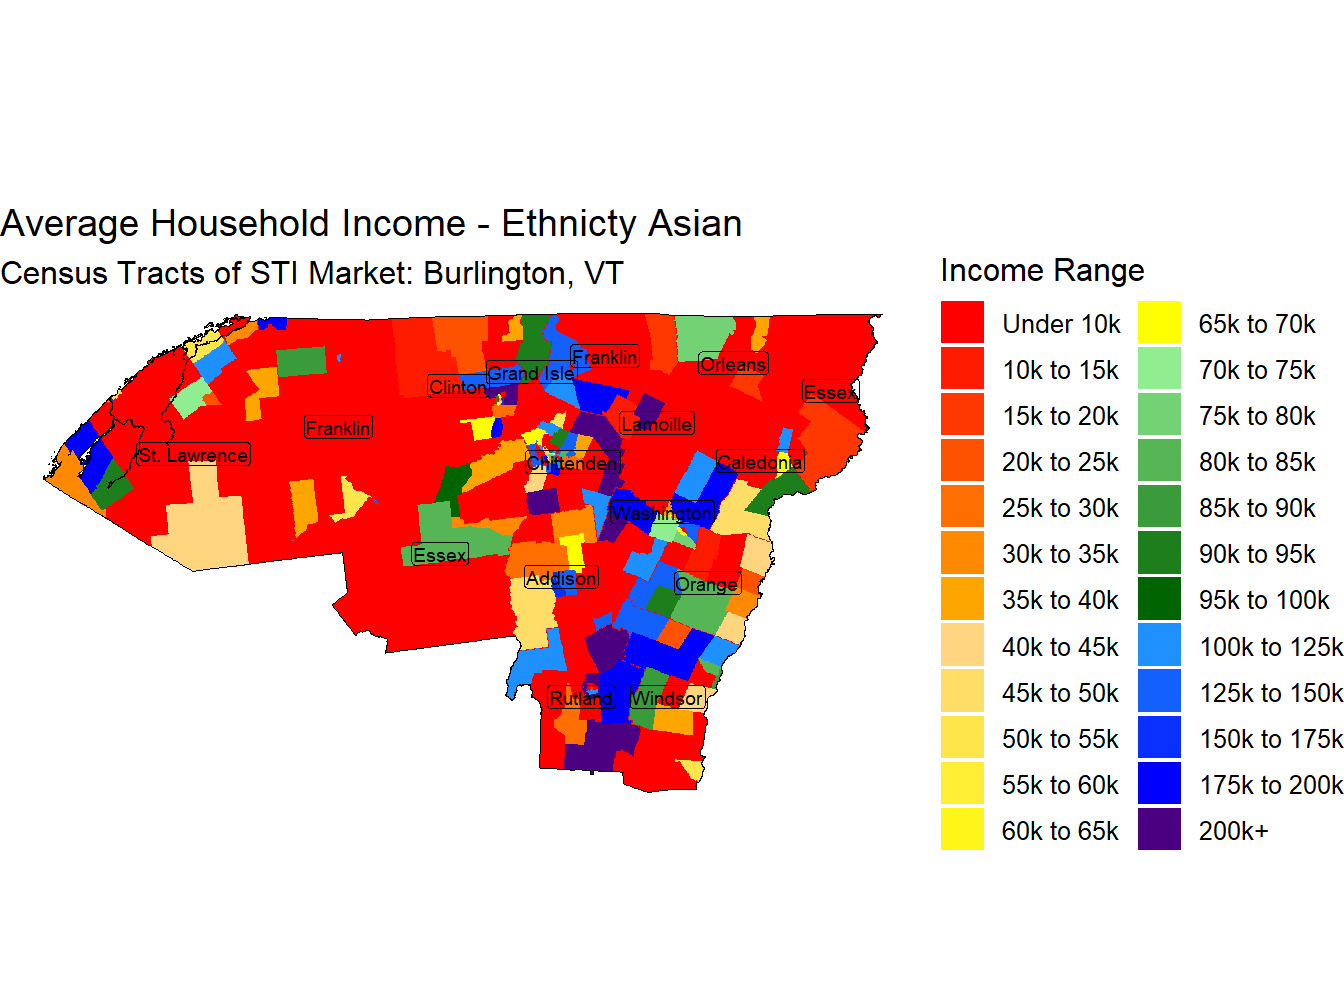
Figure 48: HHI asian Thematic
Disposible Income - $84,489
Disposable income is defined here as Household Income after accounting for Federal, State, and Local taxes. The Average Household Disposable Income is $84,489 which ranks 65th across STI Markets.
This is a drop of $25,558, or 23.22%, overall this percentage drop ranks 48th across STI Markets.
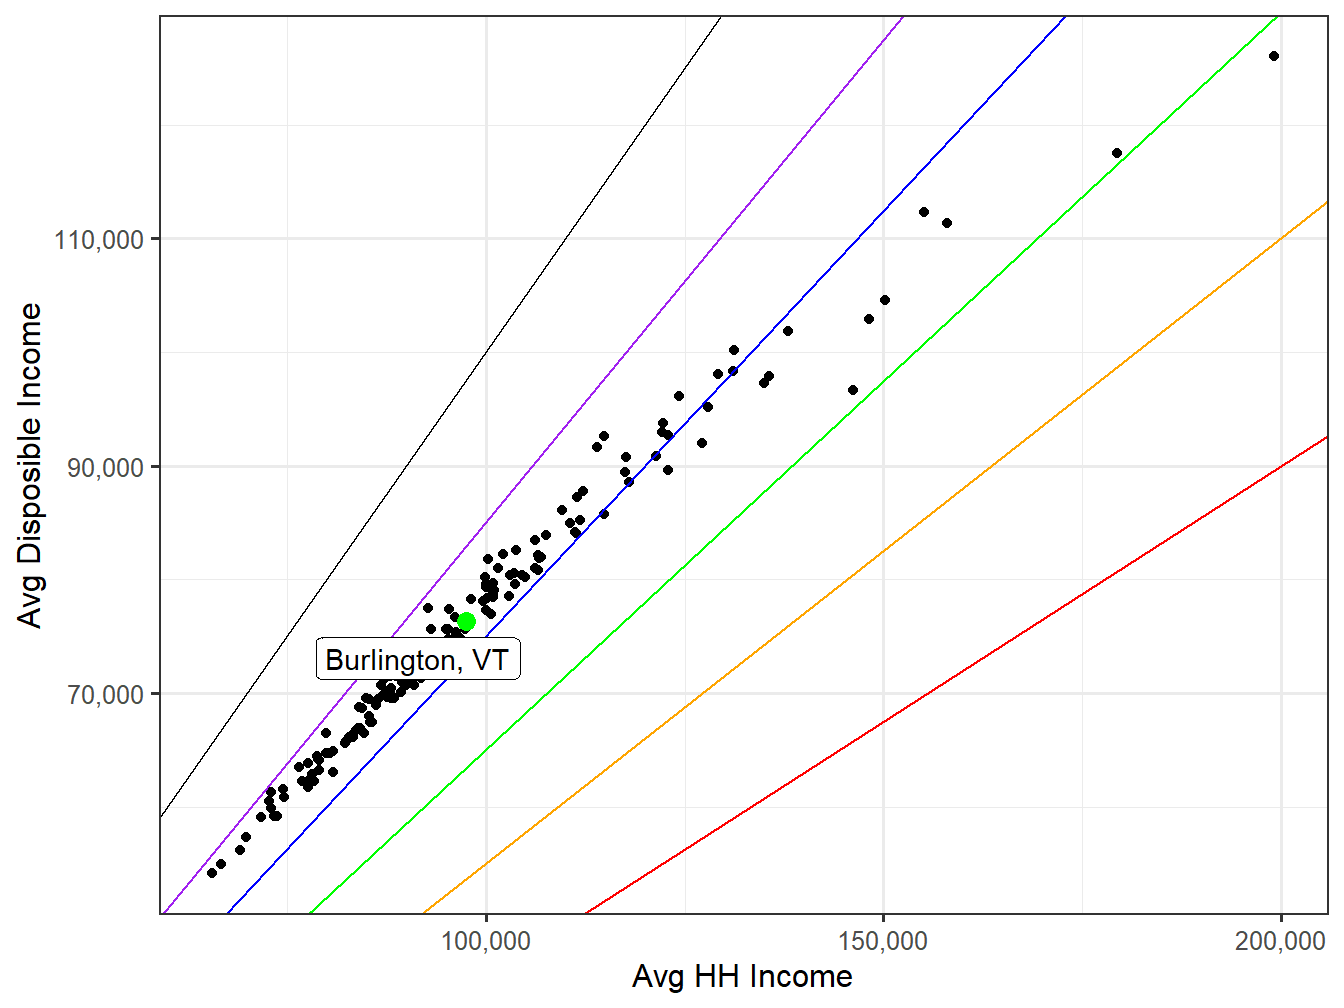
Figure 51: Disposible Income VS HH Income
Purple = 15% decrease, Blue = 25% decrease, Green = 35% decrease, Orange = 45% decrease, Red = 55% decrease
Discretionary Income - $60,589
Discretionary income goes a step further. It takes Disposable Income, which already accounts for taxes, and accounts for the typical cost of Food, Housing, and Clothing. The Average Household Discretionary Income is $60,589 which ranks 67th across STI Markets.
This is a drop of $49,458, or 44.94%, overall this percentage drop ranks 52nd across STI Markets.
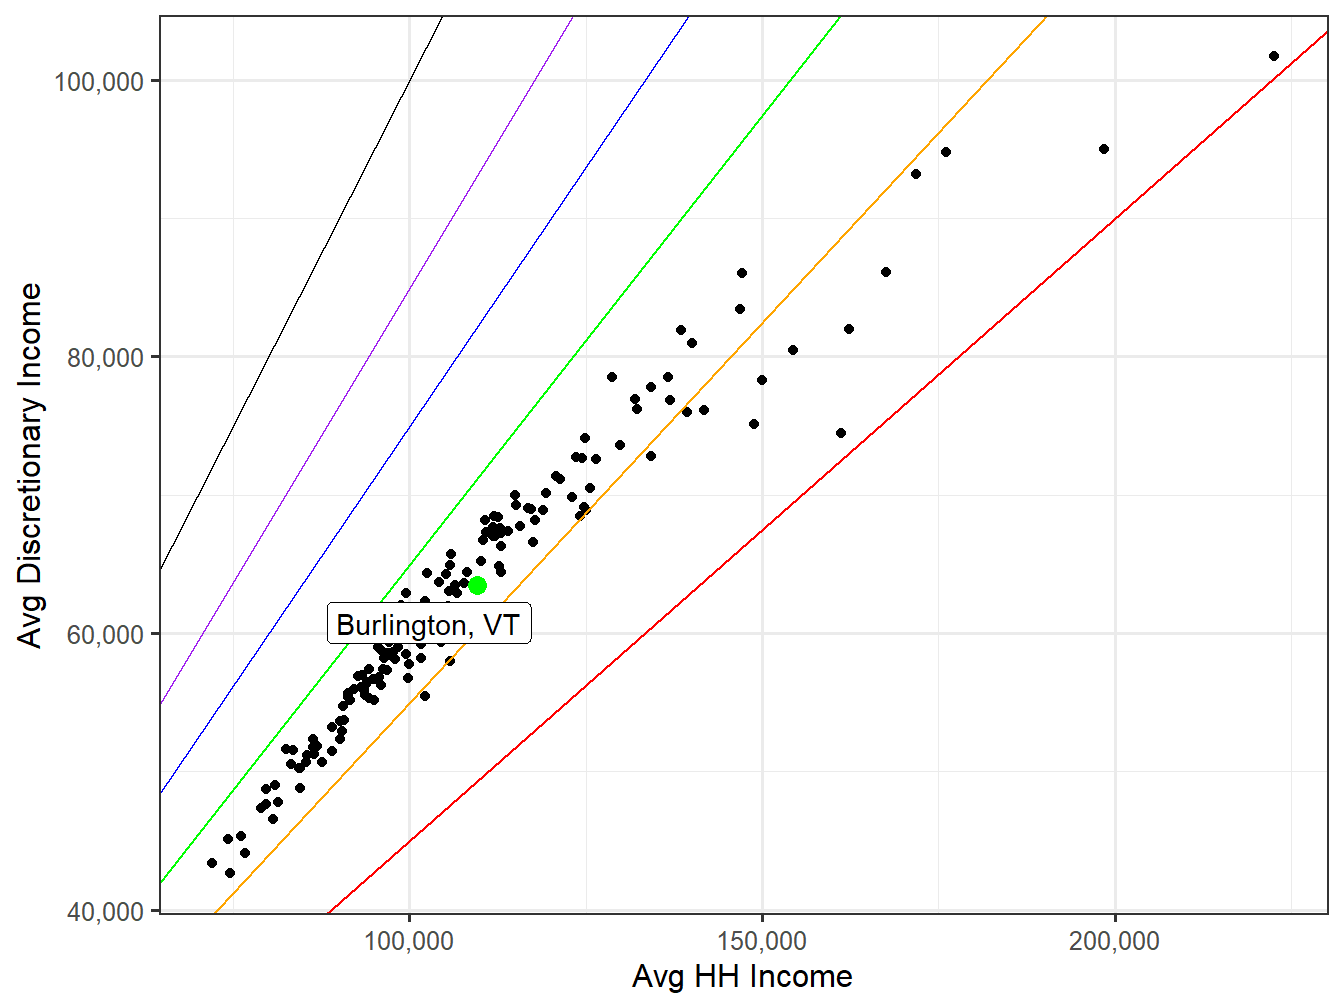
Figure 52: Discretionary Income VS HH Income
Purple = 15% decrease, Blue = 25% decrease, Green = 35% decrease, Orange = 45% decrease, Red = 55% decrease