The market’s only and most accurate quarterly demographic data
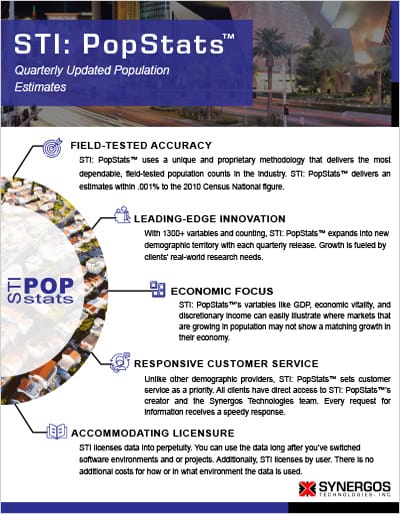
STI: PopStats™
The market’s only and most accurate quarterly demographic data.
Today, market research demands precision. It requires keen market knowledge to make the most profitable location-focused decisions, such as where to open new stores, when to close existing stores, and how to identify new business opportunities. Every research variable needs to be dependable— especially population estimates.
Since its launch in 2001, a growing number of progressive companies have come to depend on STI: PopStats™ quarterly population estimate’s accurate, current, and robust population data. They use it to capture real population growth as it occurs, estimate population counts accurately at low geographic levels, gain in-depth knowledge about specific populations, access data for both historic growth trends and future forecasts—and much more.
When you choose PopStats data to fuel your research engine, you will gain today’s leading quarterly updated population data, the highest level of population-estimating accuracy, and a robust range of population variables.
“PopStats gives us seemingly infinite knowledge about our customers – where they live, work, and travel. With PopStats we can conduct much more sophisticated market research, including locating our best customers by factors that are critical to Del Taco, such as ethnicity and income. This provides a major customer-targeting advantage, particularly in new markets.”
Elevate your research to the highest level of insight with accurate, robust, timely, and field-tested population estimates.
Track Current Population Changes
See population changes as they occur, including trade area upswings and downturns, new growth, seasonal growth, and other vital changes.
Pinpoint High-Growth Markets
Find new areas of growth before your competitors—and be the first to secure customer loyalty.
Learn More About Your Markets
Access over 1,200 data variables to conduct a wide range of research — including mortgage-risk, seasonal, transient, home values, and much more.
Choose Your Data Update Frequency
Receive updated data on an annual, semi-annual, or quarterly schedule (January, April, July, and October).
Conduct Historical and Forecasting Research
Understand markets’ past and future trends using PopStats data’s eight previous quarters of population data, and five-year and 10-year population forecasts.
Expand Your Research Insight
Attend STI’s Annual Research Conference, which provides a forum to share research, knowledge, and best practices.
Integrate Data Seamlessly
Integrate with your current research engine of choice—PopStats data works with all existing applications.
Use STI’s Free GIS Tools for Clients
Leverage a wealth of GIS data with the STI: Data Depot, and use STI: ISIS (Interactive Statistical Informational System) executive-level reporting software—all free.
Get Flexible Licensing Terms
Obtain generous licensing terms, including the use of previous year’s data, authorized data use beyond purchase year, and minimal data-use restrictions.
Receive Responsive Customer Service
Enjoy STI’s industry-leading customer service—the highest in the research industry.
PopStats data delivers the leading quarterly updated population estimates
Populations across the U.S. are constantly in flux. PopStats data captures these changes, whether up or down, as they occur —and in small geographic areas. Updated estimates are delivered on time every January, April, July, and October. Each update includes the current period and eight recent quarters of history.
PopStats data consistently delivers the highest level of accuracy
PopStats data uses a combination of unique source data from the U.S. Postal Service ZIP + 4 ® records and the U.S. Census, its own proprietary “bottom-up” methodology, and field tests to deliver the most dependable population estimates available. The ZIP + 4 source data adds a household-level quality to the estimates.
PopStats data gives companies an expanding range of consumer data
PopStats data has grown from 21 variables in 2001 to over 1,200 in 2009. All new variables are based on Synergos Technologies’s dedication to innovation and to fulfilling its clients’ specific data requests. Today researchers can access mortgage-risk data, seasonal data, transient data, eight quarters of historical data, and much more.
PopStats data delivers unlimited benefits to regional and national companies making strategic location decisions — including retailers, real estate developers, communications firms, healthcare entities, and economic development agencies. PopStats data instills greater confidence in companies’ market decisions, supports smarter market investments, and delivers a competitive advantage.