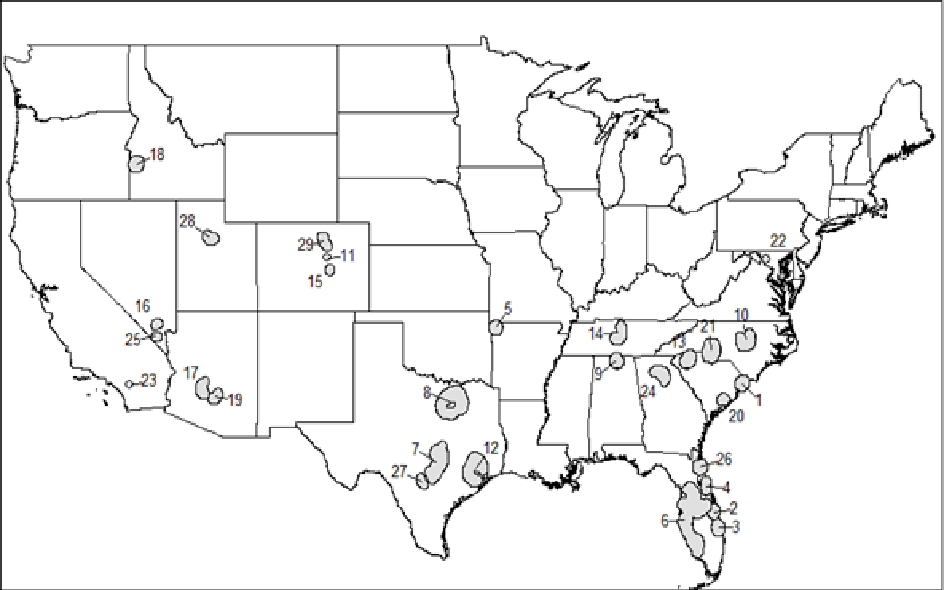
Aged Markets in Focus
Aged Markets in Focus
This week we’re examining three aged communities with a high proportion of Social Security recipients: Jonesboro, AR; Traverse City, MI; and Tampa-Lakeland-Sarasota, FL. While demographic and economic indicators offer a solid overview, data on Social Security recipients provides a clearer and more nuanced understanding of these regions..
First, the numbers:
Jonesboro, AR | Traverse City, MI | Tampa-Lakeland-Sarasota, FL | |
Population | 378,045 | 668,314 | 5,435,857 |
GDP (Billion) | $17.67 | $38.12 | 345.1 |
– National Rank | 164th | 137th | 19th |
GDP per Capita | $46,734 | $57,033 | $63,485 |
– National Rank | 166th | 145th | 116 |
Average HH Income | $63,251 | $79,751 | $95,795 |
Poverty Rate | 20.20% | 12.70% | 12.20% |
Social Security Recipients | 28.60% | 32.40% | 24% |
– National Rank | 5th | 1st | 30th |
– Retiree % | 62.40% | 73.80% | 75.50% |
– Disabled | 20% | 13% | 11.50% |
– Children % | 8.20% | 4.90% | 4.90% |
Dependency Ratio | 67 | 74.9 | 68.3 |
Seasonal Population | 30,933 | 540,113 | 690,083 |
Seasonal Ratio | 0.082 | 0.808 | 0.127 |
Demographic Composition, Social Security Recipients and Poverty
Let’s first look at social security recipients, poverty and the demographic composition of the areas, including the proportions of children and people over 65:
- Jonesboro, AR has a high poverty rate of 20.2%, suggesting significant economic challenges. The region has 28.6% of its population receiving social security benefits, with 62.4% of those being retirees. This high percentage of social security recipients, along with a considerable proportion of disabled individuals (20%), and children (8.2%) highlights a population that may be economically vulnerable, potentially reliant on social support systems.
- Traverse City, MI also shows a high percentage of social security recipients (32.4%) and a poverty rate of 12.7%. A notable characteristic of Traverse City is its substantial seasonal population (540,113) with a seasonal ratio of 0.808, indicating many residents live there only part-time. This high percentage of retirees (73.8%) and the transient nature of the population can create economic variability throughout the year.
- Tampa-Lakeland-Sarasota, FL exhibits a lower poverty rate (12.2%) compared to Jonesboro and is comparable to Traverse City. With 24% of its population receiving social security, primarily retirees (75.5%), Tampa benefits from a substantial retirement community that likely contributes economically through pensions and savings. The lower dependency ratio (68.3) suggests a balanced demographic distribution, supporting economic stability.
Income and GDP Per Capita
Income levels and GDP per capita are vital indicators of economic health and potential for growth:
- Jonesboro, AR has the lowest GDP per capita ($46,734) and average household income ($63,251) among the three regions. These figures highlight significant economic challenges and suggest limited growth potential unless substantial economic development initiatives are undertaken.
- Traverse City, MI fares better with a GDP per capita of $57,033 and an average household income of $79,751. While these figures are not as high as those in Tampa, they indicate a moderate economic environment with potential for growth, particularly if seasonal economic activities are effectively managed.
- Tampa-Lakeland-Sarasota, FL leads with a HHI of $95,795, a GDP per capita of $63,485 and the highest GDP among the three regions ($345.1 billion). These figures, along with its substantial population, suggest a robust economic base with significant disposable income, supporting a wide range of services and industries.
Seasonal Population and Economic Impact
The impact of seasonal populations can significantly influence local economies:
- Traverse City, MI has a substantial seasonal population (540,113) and a high seasonal ratio (0.808), indicating that many residents live there only part-time. This can create economic fluctuations, with peaks during high seasons and potential challenges during off-peak times. Effective management of these dynamics is crucial for sustained economic health.
- Tampa-Lakeland-Sarasota, FL also has a notable seasonal population (690,083) but with a lower seasonal ratio (0.127), suggesting a more stable year-round population compared to Traverse City. This stability can help maintain consistent economic activity and service provision.
Conclusion and Recommendations
- Jonesboro, AR faces significant economic difficulties with high poverty rates and low income levels. Economic development initiatives, enhanced social programs, and workforce training are essential to support its population and stimulate growth. Recommendation: Local government should attract Investors that focus on affordable housing, healthcare services, and community development projects to enhance the quality of life and attract new residents.
- Traverse City, MI has moderate economic indicators but must address the challenges posed by its significant seasonal population. Strategies to stabilize economic activity throughout the year and leverage seasonal influxes for long-term investments are critical. Recommendation: Tourism and hospitality investments, coupled with seasonal business models, can drive growth. Developers should consider building vacation homes and seasonal rental properties to accommodate the transient population, but also invest in infrastructure for the permanent population.
- Tampa-Lakeland-Sarasota, FL shows strong economic health with high GDP per capita and substantial income levels. Continued investment in infrastructure, diversified industries, and maintaining economic stability year-round will help sustain its growth and economic resilience. Recommendation: Focus on high-end retail, premium housing developments, and healthcare services to cater to the affluent retiree population. Mixed-use developments that combine residential, retail, and leisure spaces can provide comprehensive solutions for the community.
This high level approach can initiate important conversations about policy decisions and broad economic development strategies. Grocers, retailers, and developers have significant opportunities to contribute to and benefit from these regions’ growth by aligning their investments with the specific economic dynamics of each area.
Locating a storefront, a grocery store or planning a housing development require pinpoint precision, which is where tools like PopStats, which contains over 1,300 variables at the block group level, enable neighborhood by neighborhood analysis to target consumers and communities effectively. This allows for real-time insights into demographic and economic changes, helping businesses and policymakers make data-driven decisions to foster sustainable growth.
Learn more:
https://www.jonesboro.org/467/Economic-Development
https://www.jonesborounlimited.com/