The Palisades region of California has long been one of the coast’s emblematic communities, an area shaped by its geography, its natural beauty, and a steady, decades-long pattern of residential growth. From the early 2000s to its population peak around 2009–2013, the Palisades climbed from just over 10,000 residents to more than 16,000. It was the kind of slow-and-steady coastal growth that reflected a broader Southern California story: rebuilds, infill, rising home values, and the magnetic pull of ocean-adjacent living.
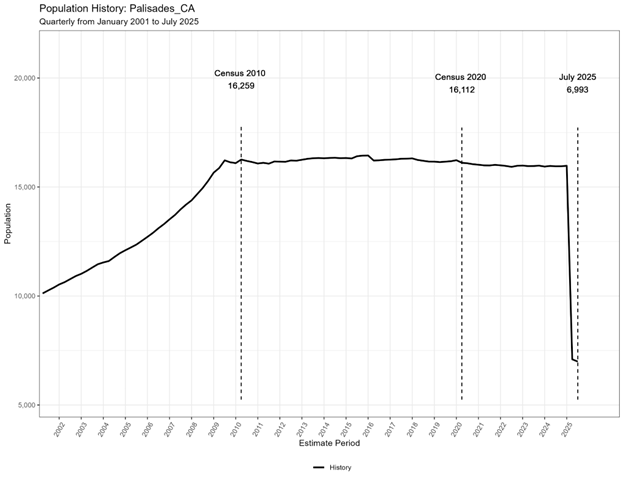
Our population and households history product, tracking quarterly estimates since 2001, illustrates this arc beautifully. You can see the rise heading into the 2010 Census (16,259), the stabilization leading into the 2020 Census (16,112), and then a gradual leveling as the area matured.
But history, especially in California, also includes moments of rupture.
The Firestorms and Their Aftermath
In the late 2010s and early 2020s, major wildfire seasons reshaped communities across the state. The Palisades was no exception. Fires damaged hundreds of structures, displaced families, and triggered a multi-year sequence of migration, temporary relocations, insurance-driven rebuilds, and stalled housing turnover.
The most recent and arguably the most devastating fire to affect The Palisades area happened in January 2025. We recently dove into the numbers for a couple of Kalibrate customers who were curious about the effect of the fire and the ensuing recovery. Our April 1st estimate captures the steep population decline only a few months after the tragic event.
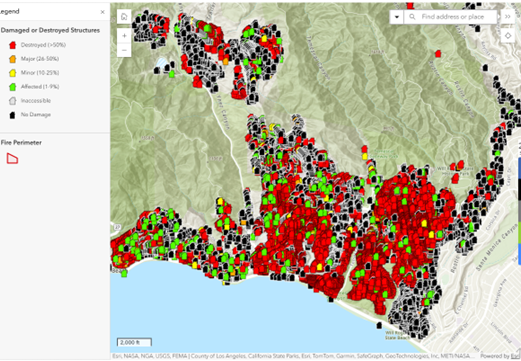
Image Credit: County of Los Angeles https://recovery.lacounty.gov/palisades-fire/
Most demographic updates in the industry arrive annually. That’s useful for long-term planning, but it’s not enough to detect fast-moving changes, whether caused by natural disasters, economic shifts, or short-term population displacement.
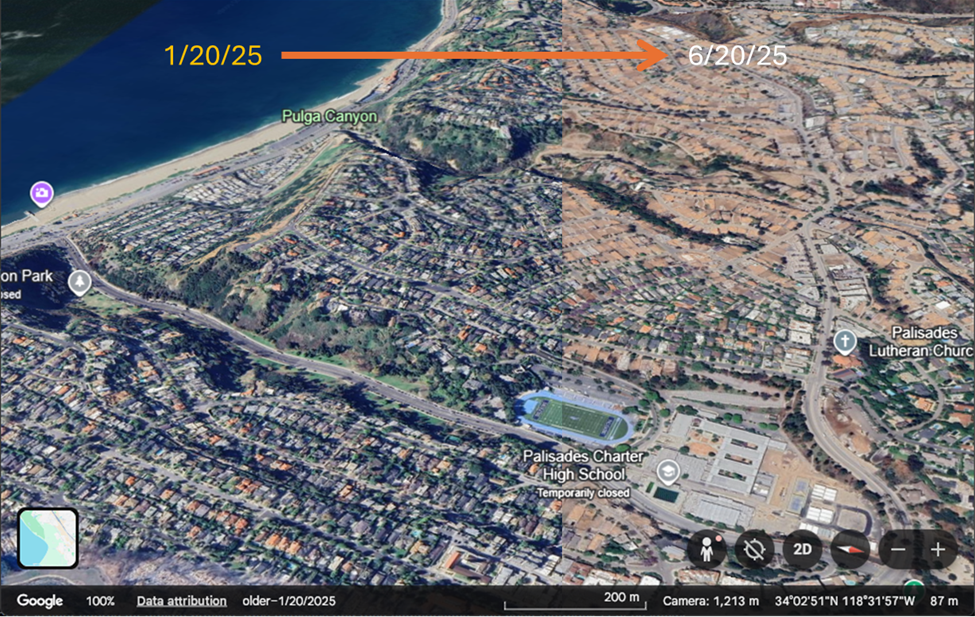 Image credit: Google Earth
PopStats™ estimates are released four times per year, allowing us to:
- Detect rapid declines or disruptions as they happen
- Distinguish temporary volatility from actual household loss
- Identify turning points when people begin returning and rebuilding
- Provide retailers, developers, and public agencies with near real-time intelligence
The Palisades decline is a textbook example of why frequency matters. Because we update quarterly, our data captures the cliff rather than smoothing it away. The chart tells the story clearly: a neighborhood that spent two decades growing and stabilizing suddenly contracted into a fraction of its former population.
Kalibrate’s client’s interest in Pacific Palisades population trends was driven by a very practical question: when is it viable to reopen? While many structures, like Wendy’s, Chase, and Chipotle, remained standing after the fires, businesses needed to understand the community’s recovery before committing resources.
They were focused on two key considerations:
- Critical Mass for Reopening – At what point does the returning population reach a minimum threshold to support operations?
- Demographic Shifts – Will the rebuilt community look the same as before? Are residents older, wealthier, or more likely to have families?
The client already had customer data showing how many of their customers lived in the Palisades, but they needed demographic insights to guide timing and strategy.
Whether it’s rebuilding commercial corridors, planning emergency services, assessing school district capacity, or evaluating real estate strategies, decisions improve when data reflects today, not last year. And as our country continues to face climatic, economic, and demographic shifts, having timely insight is no longer a luxury. It’s a necessity.