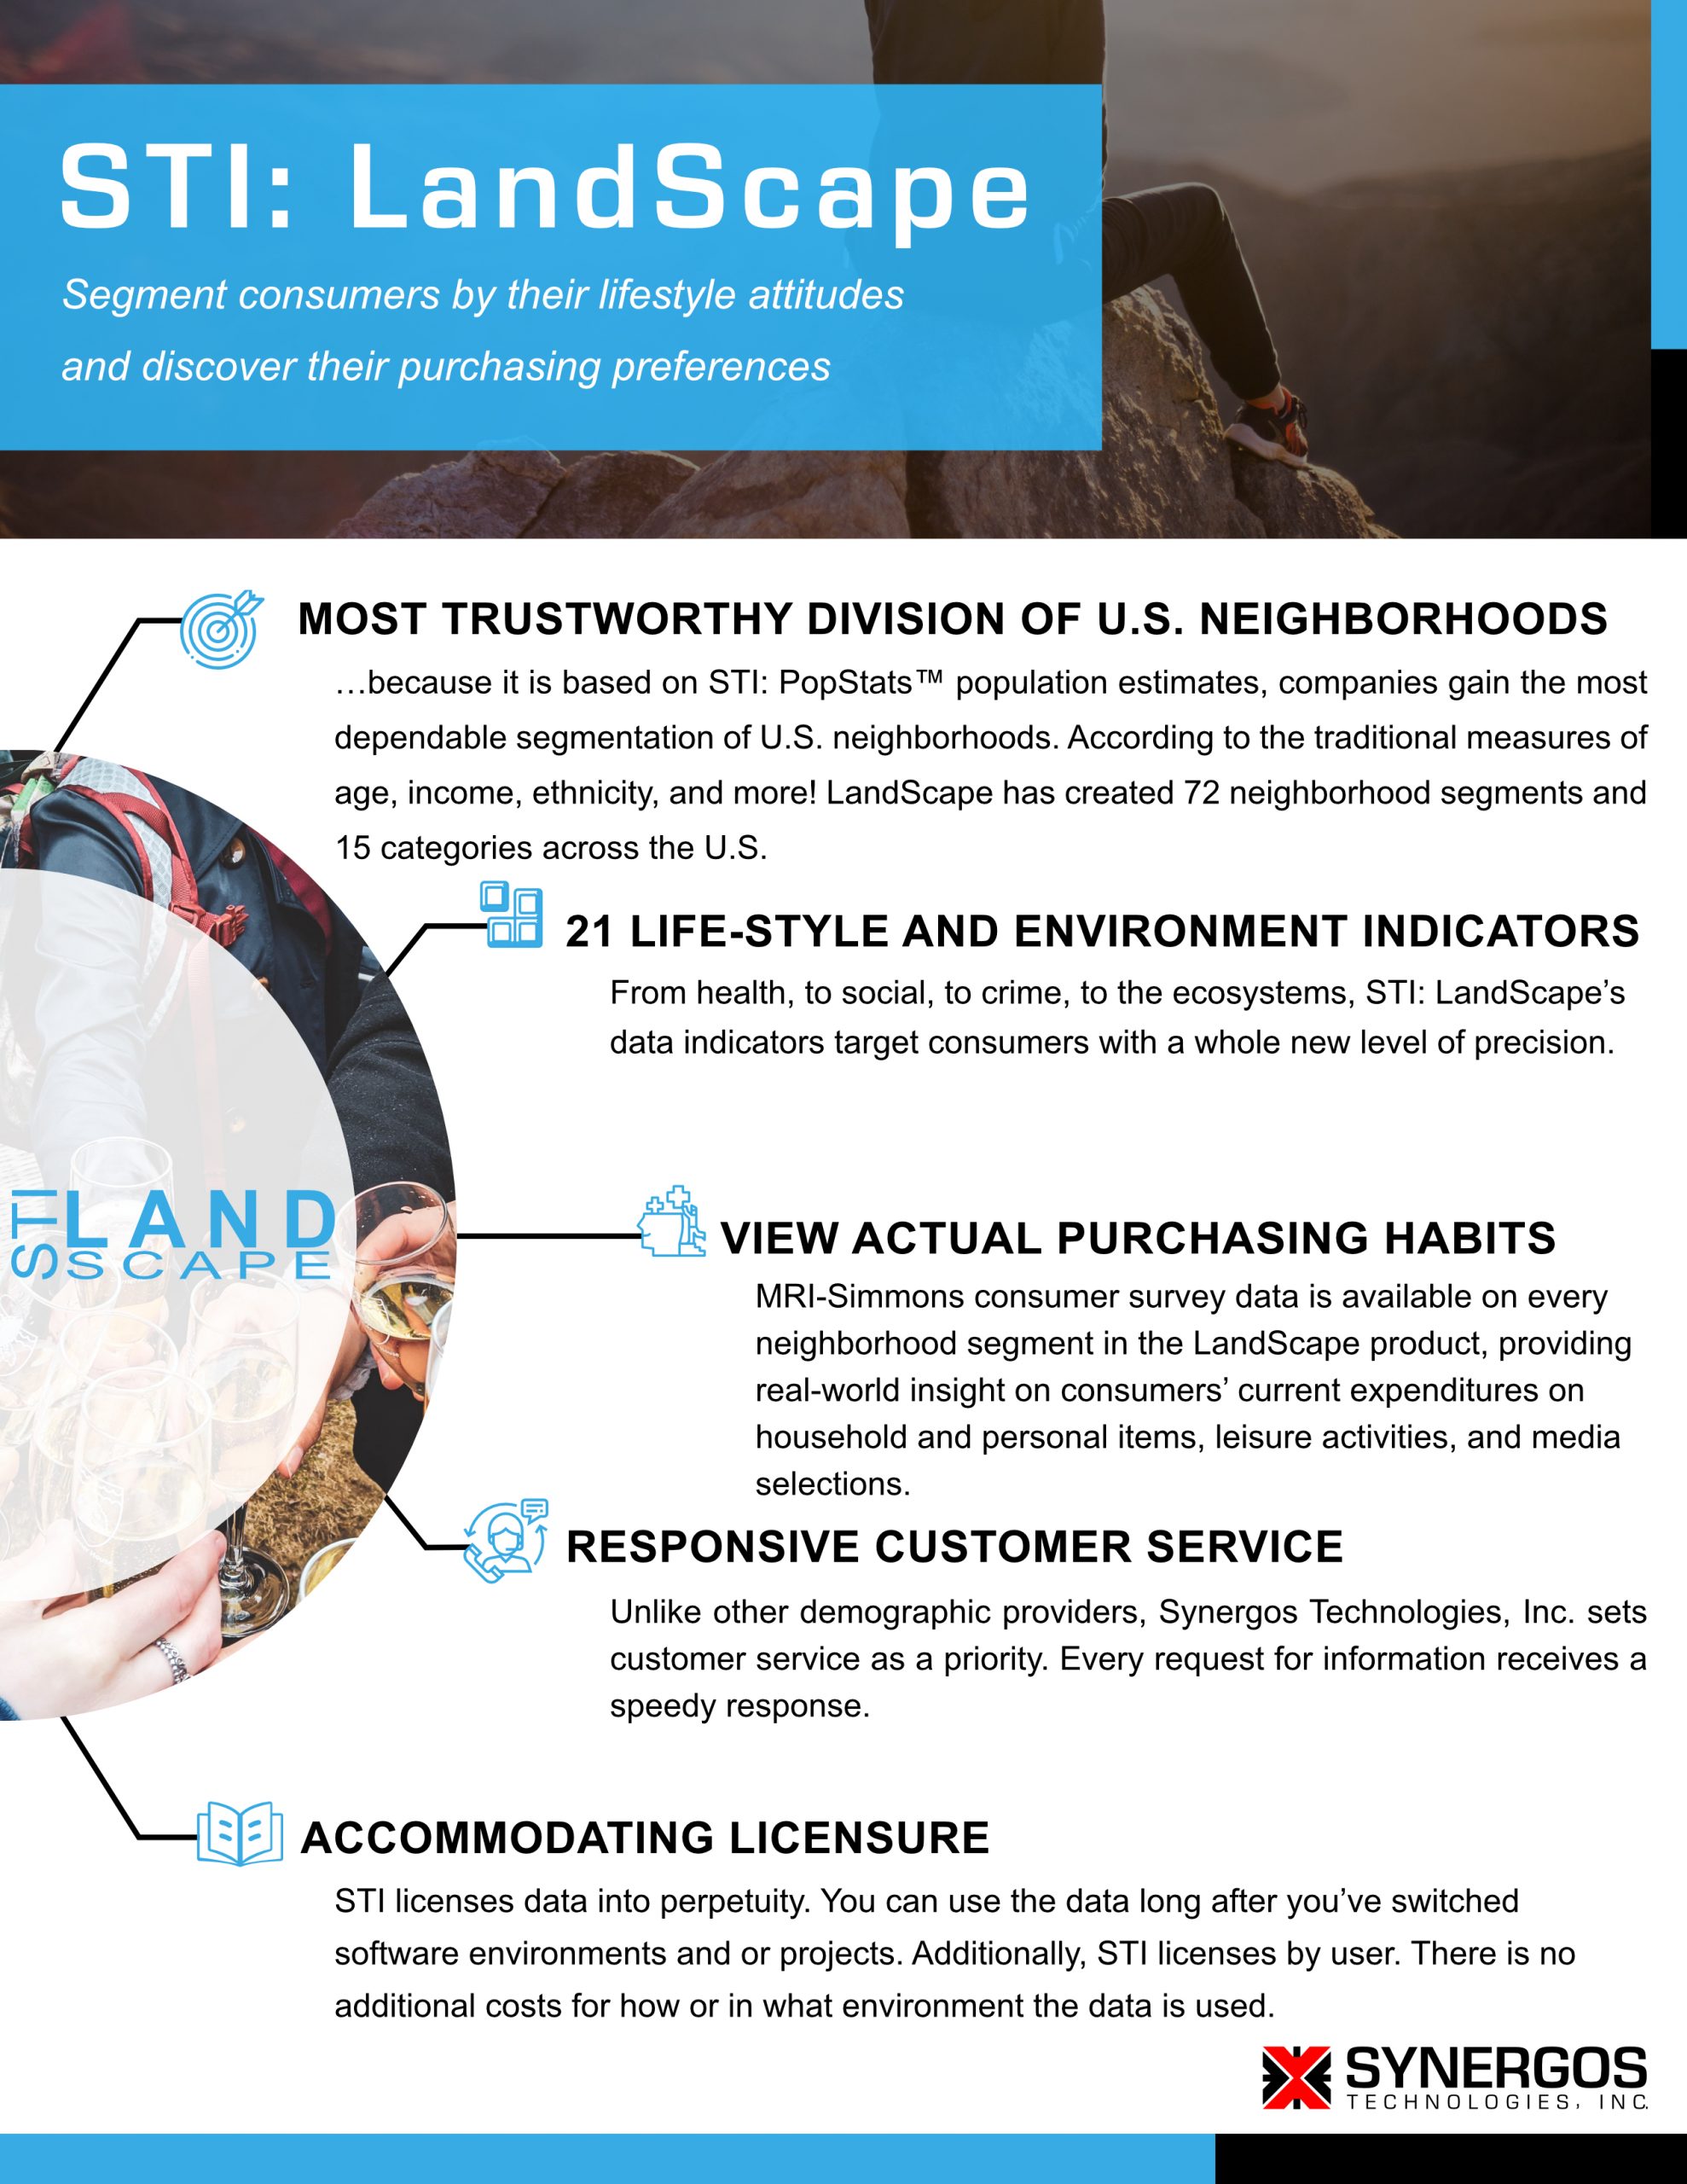
|
STI: LandScape™ - Methodology
Your Data Building Blocks for Discovering the Attitudes that Influence Consumers' Purchases
STI: LandScape™ is an innovative neighborhood segmentation system that first
groups consumers by traditional geodemographic characteristics, and then offers
companies the opportunity to further segment consumers by innovative lifestyle
attitudes that influence consumers' distinctive purchasing styles.
The LandScape neighborhood segmentation system includes 15 categories and 72
segments created by clustering consumers at the U.S. Census block group level
who share similar geodemographic characteristics, including family status,
affluence, age, ethnicity, and level of urbanization, and who are statistically
different from other consumer segments.
In addition, unlike any other segmentation system, the LandScape product offers 21 optional
Lifestyle and Environmental Indicators that deliver even more fine-grained
consumer segmentation. These Indicators were created using data from leading
U.S. organizations, such as the CDC, FBI, and USDA.
Also, STI partners with Mediamark Research to offer LandScape data users direct
access to leading consumer survey data, covering every major purchasing
category.
Why Consumer Lifestyle Attitudes are Important?
For decades, retailers have used socio-economic-based market segmentation tools
to identify who their customers are demographically and where they live
geographically. But today's intensifying business challenges require even more
sophisticated consumer segmentation.
Lifestyle and Environmental Indicators deliver a powerful new way to understand
consumers' purchasing propensities. For example, one household may be the first
to purchase new technology, while another may wait years to adopt new phones,
TVs, and computers. One household may exercise regularly, while another prefers
a sedentary lifestyle. One household could be influenced by the GLBT lifestyle,
while another is more conservative. The LandScape product's innovative Indicators help make
distinctions such as these among consumer groups.
For example, when comparing two typical families living in the same
neighborhood, typical segmentation may find that they are both
upper-middle-class, have 2.5 children, live in highly urban areas, and have
40-something heads-of-the-households. Demographically speaking, the they are
the same. However, the LandScape Indicators also show that their attitudes are
very different. One family votes conservatively and the other less
conservatively. As a result, one household may be more likely to purchase a
Lexus and the other a Cadillac two similarly priced products representing two
different lifestyle choices. The LandScape indicators have the power to parse out these
subtle consumer lifestyle differences so companies can make more informed and
profitable business decisions.
Part 1 - The LandScape Product's 15 Categories and 72 Segments Methodology
Neighborhood segmentation is fundamentally the science of differences. While it
groups households together in a general "birds-of-a-feather" philosophy, it also
separates consumers who are dissimilar. Along with the traditional
socio-economic attributes that distinguish every household, each household also
has a set of lifestyle attitudes that influence its residents' buying habits.
With this in mind, STI initially attempted to merge traditional demographic data
with non-demographic "attitudinal" consumer data. However, this level of
segmentation created about 500 neighborhood segments. This was not acceptable,
because every segmentation system relies on an economics-of-scale rule. This
rule dictates that each segment must have a significant enough base of similar
customers to make the market worth targeting. As a result, STI first segmented
U.S. neighborhoods at the block group level using STI: PopStats data and a
classic segmentation methodology. Then STI created 21 Lifestyle and
Environmental Indicators that can be appended onto the segments for more
fine-grained segmentation.
The LandScape neighborhood categories and segments are created using a combination
of two mathematical techniques: Factor Analysis, which is the process used to
identify the primary factors that characterize neighborhoods, and Recursive
Partitioning, which is the process used to refine those factors into smaller and
more meaningful groups.
Factor Analysis. In most cases, only a handful of factors describe the majority
of discrepancies between groups or events. Therefore, as STI's segmentation
models progressed through their analysis, the models constantly evaluated which
factors are the keys to describing and, more importantly, differentiating market
segments. For example, they found the following demographic categories have the
greatest impact on distinguishing neighborhood segments: age, income,
ethnicity, education, marital status, dwelling type, and presence of children.
In addition, factor analysis allows for many other demographic characteristics
to enter into the neighborhood segmentation analysis.
Recursive Partitioning. In data analysis, recursive partitioning means to split
a dataset into two or more subgroups to improve the homogeneity of each
subgroup. The partitioning process recurs until a desired outcome is achieved:
which, in the case of LandScape data, was when a reasonable size and number of market
segments were created. The LandScape model was constructed by first identifying
the factors that best subdivided the data into a set of groups. Then each
subgroup was evaluated again with factor analysis to determine the best way to
subdivide it, and so forth and so on. To insure that certain highly specialized
sub-groups did not influence the factoring process, they were first removed from
the equation (e.g., group quarters).
Part 2 - The LandScape Product's Lifestyle and Environmental Indicators Methodologies
The LandScape product's 21 optional consumer Indicators can be appended to the neighborhood categories and segments. Each Indicator is mutually exclusive and can be used alone or in combination. The Indicators cover five categories: Social, Health, Crime, Environment, and Migration.
Social Indicators
- Technology Pioneers. Based on the correlation between innovation adoption and occupations, education, and industry affiliations.
- Power Brokers. Measures people's financial support of political activities and social issues based on the Federal Elections Committee (FEC).
- Conservatism. Measures people's support of conservative issues in precinct-level elections.
- Gay Chic. A measure of people's association with the GLBT lifestyle based correlative research.
- Urban Views. This measure of population and business density is created by combining data from STI: PopStats and STI: WorkPlace data.
Health Indicators
- Health Zone. An amalgamated score of the other four CDC health indices.
- Size Matters. From a CDC survey measuring the population's body-mass index.
- Eat Your Veggies. This CDC survey indicates people's propensity to eat veggies and fruits.
- Smoke Signals. Data from the CDC survey measures the number of smokers.
- Bodies in Motion. The CDC survey data on people's activity levels.
Crime Indicators
- Burglary Crime Risk. Crimes in which property is stolen or taken against the owner's will, as reported by the FBI's Uniform Crime Reports (UCR).
- Larceny Crime Risk. The unlawful taking of property from the FBI's UCR.
- Motor Vehicle Theft Risk. Stolen vehicles from the FBI's UCR.
- Robbery Crime Risk. The taking or attempted taking of property from the FBI's UCR.
- Aggravated Assault Crime Risk. Unlawful attacks from the FBI's UCR.
Ecoregions Indicators
- The Business Climate. Weather rankings from the National Climatic Data Center (NCDC).
- Exploring Ecoregions. A geographical index from the U.S. Geological Survey (USGS).
- The Gardening Zone. Rankings of geographical planting zone data according to the U.S. Department of Agriculture (USDA).
- Birds-Eye Views. Ranks geographical data on elevation and terrain from the USGS.
- Water World. Ranks neighborhoods' proximities to navigable bodies of water based on data from the USGS.
Migration Indicator
- Americans on the Move. Ranks population migration at the county level based on data from the IRS's migration files.
The LandScape Partnership with Mediamark Research
Mediamark Research & Intelligence (MRI) conducts the leading national survey on
consumers' purchasing habits, called the Survey of the American ConsumerT. This
survey data is available to LandScape data users. STI and MRI created this
partnership to be more responsive to companies conducting consumer research.
Through this alliance of two of the most respected consumer data providers,
companies can gain access to an unprecedented selection of consumer intelligence
at the neighborhood level.
MRI's survey collects information on adult consumers' media choices, product
use, demographics, and lifestyles. The use of nearly 6,000 product and service
brands across 550 categories are measured, along with the readership of hundreds
of magazines and newspapers, Internet use, TV viewership at the program level,
national and local radio stations, Yellow Pages use, and out-of-home exposure.
To capture this high-resolution view of the market, MRI does something unique in
the survey industry: every year 26,000 consumers are interviewed, face-to-face,
in their homes. This unique research method delivers higher levels of
reliability, credibility, and completeness than traditional mail and phone
surveys. Also, because it's single-source survey, the data provides a detailed
picture of the fragmented and continually evolving media marketplace and the 220
million adults who drive it. One set of answers from one set of respondents
allows marketers to better understand the context in which media and consumer
choices are made.
LandScape Opens Doors to Consumers' Lifestyles and New Research Opportunities
The combination of the LandScape product's 72 segments, 21 Lifestyle and Environmental
Indicators, and Mediamark's survey data gives companies a complete spectrum of
insight on consumers including where they live and who they are
geodemogrpahically, their attitudes are on everything from politics to health,
and what they are actually purchasing for their home, personal life, and
leisure.
Unlike other neighborhood segmentation systems, LandScape data allows companies to
open doors to new opportunities and innovative frontiers in consumer and market
research. These new levels of consumer insight allow companies to better target
consumers, understand markets, and make more informed decisions in every
department across their enterprise including site selection, merchandising,
and marketing.
|
Announcements

A Migrating Population - Using IRS Data to Track Movement Patterns Check out the maps now! Chat with us for more info

The PopStats™ COVID-19 Impact Report: Available Now! Chat with us for more info
|